. 2010 Dec 21;107(51):22020-5.
doi: 10.1073/pnas.1009094108. Epub 2010 Dec 13.

A high-resolution human contact network for infectious disease transmission

Affiliations

A high-resolution human contact network for infectious disease transmission

Marcel Salathé et al. Proc Natl Acad Sci U S A. .

Abstract

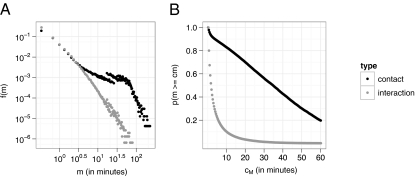
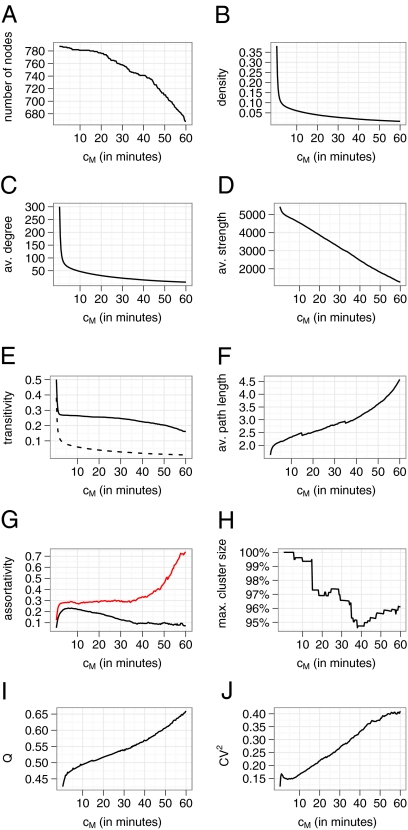
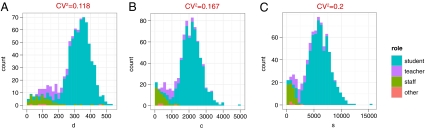
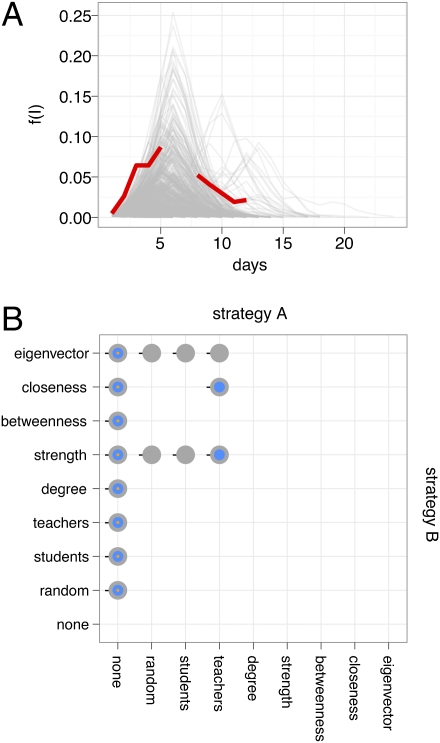
The most frequent infectious diseases in humans--and those with the highest potential for rapid pandemic spread--are usually transmitted via droplets during close proximity interactions (CPIs). Despite the importance of this transmission route, very little is known about the dynamic patterns of CPIs. Using wireless sensor network technology, we obtained high-resolution data of CPIs during a typical day at an American high school, permitting the reconstruction of the social network relevant for infectious disease transmission. At 94% coverage, we collected 762,868 CPIs at a maximal distance of 3 m among 788 individuals. The data revealed a high-density network with typical small-world properties and a relatively homogeneous distribution of both interaction time and interaction partners among subjects. Computer simulations of the spread of an influenza-like disease on the weighted contact graph are in good agreement with absentee data during the most recent influenza season. Analysis of targeted immunization strategies suggested that contact network data are required to design strategies that are significantly more effective than random immunization. Immunization strategies based on contact network data were most effective at high vaccination coverage.


Conflict of interest statement

The authors declare no conflict of interest.

Figures

Fig. 1.
Fig. 1.
(A) Normalized frequency, f, of interactions and contacts of duration m (in minutes) [f(m)] on a log-log scale. (B) Percentage, p, of total time of all CPIs by interactions and contacts with a minimum duration, cm (in minutes). Most CPI time is spent in medium-duration contacts consisting of repeated short interactions.
Fig. 2.
Fig. 2.
Various statistics on the contact graph with minimum contact duration, cm (i.e., the left-most point in each panel represents the full contact graph, the right-most point represents the contact graph that contains only contacts that are at least 60 min long). With increasing cm, nodes drop out of the network if they have no contact that satisfies the minimum duration condition. (A) Hence, the reduction in the number, V, of nodes. (B) Density of the graph (2E/[V*(V − 1)]), where E is the number of edges. (C) Average (av.) degree. (D) av. strength, where the strength of a node is the total number of CPRs of the node. (E) Transitivity (i.e., cluster coefficient) as defined by Barrat et al. (25) and expected value (mean degree/V) in a random network (dashed line). (F) Average path length. (G) Assortativity (23) with respect to degree (black line) and role (red line). (H) Size of the largest component as a fraction of total network size. max., maximum. (I) Modularity, Q, as defined by Reichardt and Bornholdt (39). (J) CV2 of degree.
Fig. 3.
Fig. 3.
Distribution and CV2 of degree, d (A); number of interactions, c (B); and strength, s (C), based on the full contact network and colored by the role of individuals.
Fig. 4.
Fig. 4.
(A) Absentee data (red) and data generated by the SEIR model (gray; 1,000 runs with R0 >1 shown). Gray lines show frequency of infectious individuals, f(I); red lines show the combined frequency of students who reported, or were diagnosed with, a fever and teachers who were absent (gap in the line attributable to weekend). (B) Differences in effect of vaccination strategies. Colors represent vaccination coverage of 5% (orange), 10% (blue), and 20% (gray). A point at the intersection of strategy A and strategy B indicated that between those strategies, there was a significant difference (P < 0.05, two-sided Wilcoxon test) in the outbreak size at all transmission probability values at the given vaccination coverage. A black horizontal or vertical line points in the direction of the strategy that resulted in smaller outbreak sizes. Because of the symmetry of the grid, data points below the left bottom and top right diagonal line are not shown.

References

    1. Murray CJL, Lopez AD, Chin B, Feehan D, Hill KH. Estimation of potential global pandemic influenza mortality on the basis of vital registry data from the 1918-20 pandemic: A quantitative analysis. Lancet. 2006;368:2211–2218. - PubMed
    1. Meltzer MI, Cox NJ, Fukuda K. The economic impact of pandemic influenza in the United States: Priorities for intervention. Emerg Infect Dis. 1999;5:659–671. - PMC - PubMed
    1. Halloran ME, et al. Modeling targeted layered containment of an influenza pandemic in the United States. Proc Natl Acad Sci USA. 2008;105:4639–4644. - PMC - PubMed
    1. Yang Y, et al. The transmissibility and control of pandemic influenza A (H1N1) virus. Science. 2009;326:729–733. - PMC - PubMed
    1. Fiore A, et al. Prevention and control of influenza: Recommendations of the Advisory Committee on Immunization Practices (ACIP) MMWR Recomm Rep. 2008;59(RR-8):1–62. and erratum (2010) 59:1147. - PubMed

Publication types