Comparative Study
. 2011:3:87-101.
doi: 10.1093/gbe/evq084. Epub 2010 Dec 13.

Comparative genomics of the vertebrate insulin/TOR signal transduction pathway: a network-level analysis of selective pressures

Affiliations
Comparative Study

Comparative genomics of the vertebrate insulin/TOR signal transduction pathway: a network-level analysis of selective pressures

David Alvarez-Ponce et al. Genome Biol Evol. 2011.

Abstract

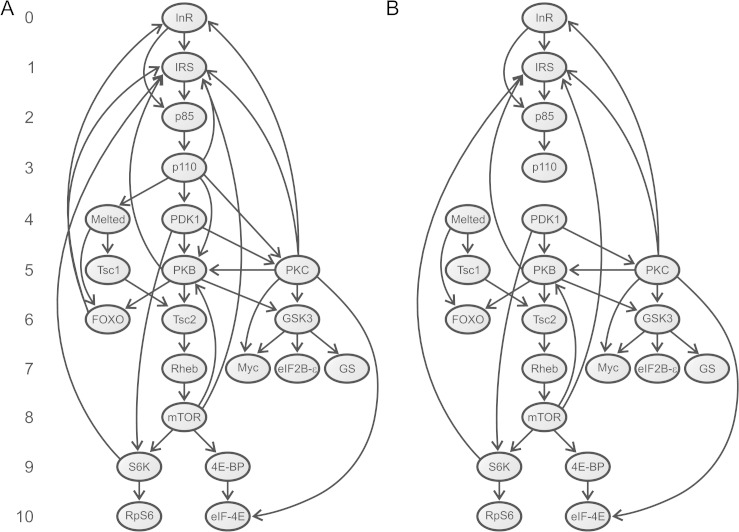
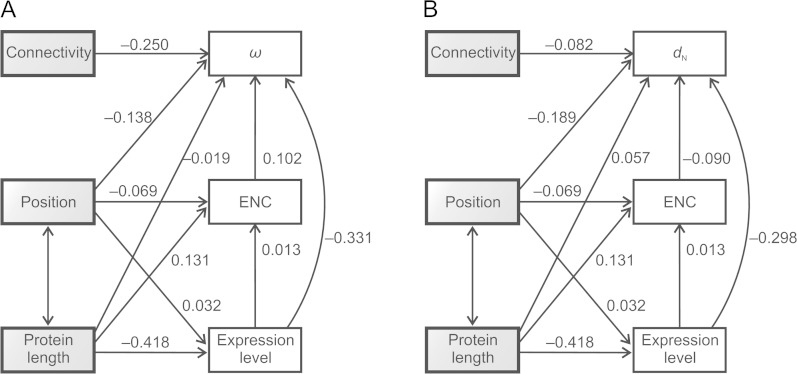
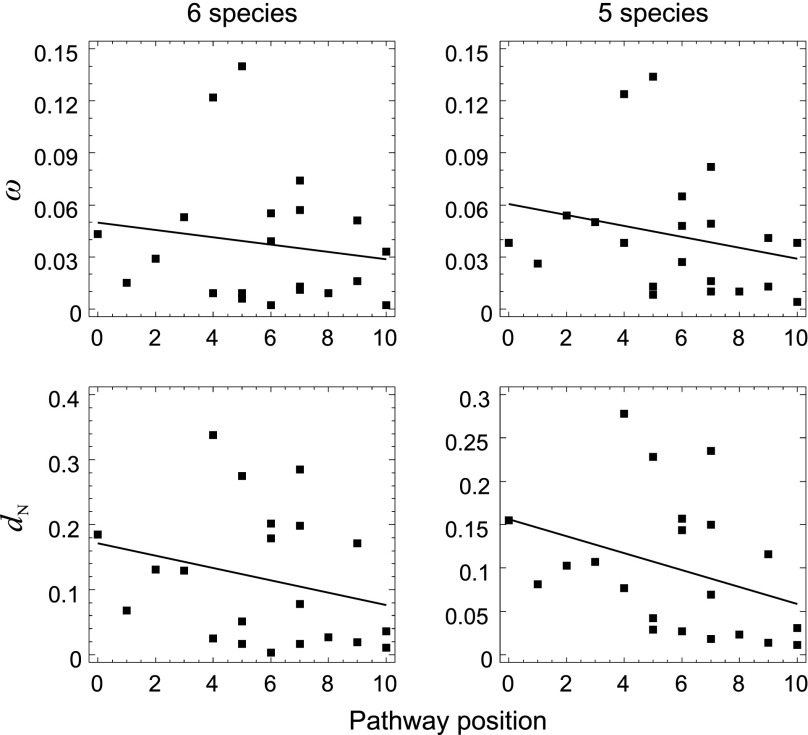
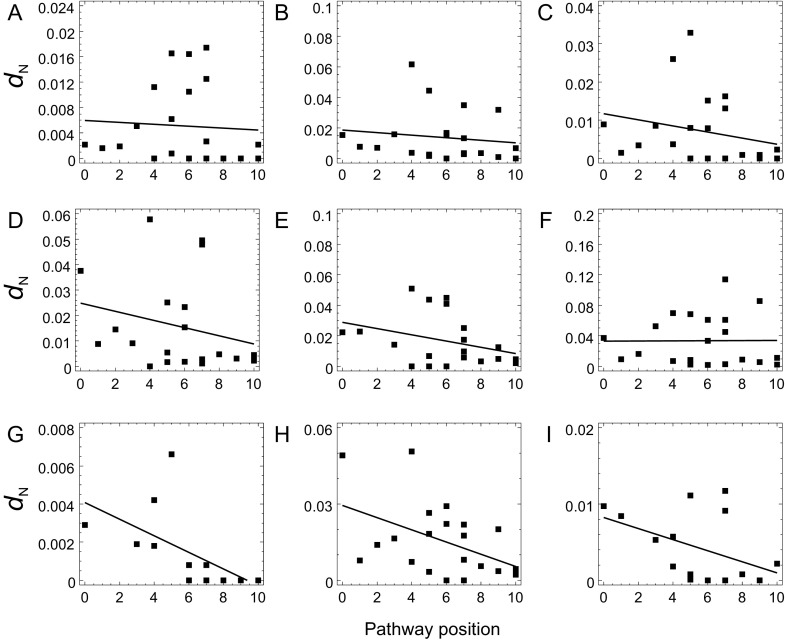
Complexity of biological function relies on large networks of interacting molecules. However, the evolutionary properties of these networks are not fully understood. It has been shown that selective pressures depend on the position of genes in the network. We have previously shown that in the Drosophila insulin/target of rapamycin (TOR) signal transduction pathway there is a correlation between the pathway position and the strength of purifying selection, with the downstream genes being most constrained. In this study, we investigated the evolutionary dynamics of this well-characterized pathway in vertebrates. More specifically, we determined the impact of natural selection on the evolution of 72 genes of this pathway. We found that in vertebrates there is a similar gradient of selective constraint in the insulin/TOR pathway to that found in Drosophila. This feature is neither the result of a polarity in the impact of positive selection nor of a series of factors affecting selective constraint levels (gene expression level and breadth, codon bias, protein length, and connectivity). We also found that pathway genes encoding physically interacting proteins tend to evolve under similar selective constraints. The results indicate that the architecture of the vertebrate insulin/TOR pathway constrains the molecular evolution of its components. Therefore, the polarity detected in Drosophila is neither specific nor incidental of this genus. Hence, although the underlying biological mechanisms remain unclear, these may be similar in both vertebrates and Drosophila.


Figures

F<sc>IG</sc>. 1.
FIG. 1.
Directed graphs used in the network-level analyses. (A) Graph G containing all interactions (arcs) among human IT pathway proteins (nodes). This graph consists of 21 nodes and 39 arcs, of which 32 represent PPIs, five involve the membrane phospholipid PIP3 (synthesized by p110 isoforms and activates the IRS, Melted, PDK1, PKB, and PKC proteins), and the other two represent the activation of the INR and IRS2 genes by the FOXO transcription factors (Puig and Tjian 2005). Numbers on the left indicate the position of each component in the pathway. Human proteins having orthologs in Drosophila (Alvarez-Ponce et al. 2009) were assigned the same position as their Drosophila counterpart. We assigned position 5 to PKC proteins because they are activated by PDK1 (position 4) (LeRoith et al. 2004). We excluded the phosphoinositide phosphatase PTEN from network-level analysis because it does not directly interact with any other element in the graph (for review, see Vinciguerra and Foti 2006). The cytohesins Cyh1–4 were also excluded because their specific function in the pathway remains unclear (Hafner et al. 2006). (B) Graph S, subgraph of G containing only the 32 physical interactions. Both graphs were constructed using information gleaned from the literature.
F<sc>IG</sc>. 2.
FIG. 2.
Phylogenetic relationships among the six vertebrate species used in this study. Tree topology and divergence times were taken from Ponting (2008).
F<sc>IG</sc>. 3.
FIG. 3.
Path analysis for data set 2. Single- and double-headed arrows represent assumed causal dependencies and correlations, respectively. Numbers in each arrow represent the standardized path coefficients (β). None of the associations was significant. The analyses conducted using expression breadth instead of expression level yielded equivalent results. (A) Analysis for ω. (B) Analysis for dN.
F<sc>IG</sc>. 4.
FIG. 4.
Correlation between pathway position and ω and dN under the M0 model (data set 2) including (six species) and excluding (five species) Ornithorhynchus anatinus. Continuous lines represent regression lines. An extended version of this figure is provided as Supplementary Material (supplementary fig. S1, Supplementary Material online).
F<sc>IG</sc>. 5.
FIG. 5.
Correlation between pathway position and dN (under the FR model) in all nine phylogenetic branches (data set 2). Panels AI correspond to branches ai in figure 2. Continuous lines represent regression lines.

References

    1. Alvarez-Ponce D, Aguadé M, Rozas J. Network-level molecular evolutionary analysis of the insulin/TOR signal transduction pathway across 12 Drosophila genomes. Genome Res. 2009;19:234–242. - PMC - PubMed
    1. Antoine M, Fried M. The organization of the intron-containing human S6 ribosomal protein (rpS6) gene and determination of its location at chromosome 9p21. Hum Mol Genet. 1992;1:565–570. - PubMed
    1. Benjamini Y, Hochberg Y. Controlling the false discovery rate: a practical and powerful approach to multiple testing. J R Stat Soc Ser B Stat Methodol. 1995;57:289–300.
    1. Bossi A, Lehner B. Tissue specificity and the human protein interaction network. Mol Syst Biol. 2009;5:260. - PMC - PubMed
    1. Castillo-Davis CI, Kondrashov FA, Hartl DL, Kulathinal RJ. The functional genomic distribution of protein divergence in two animal phyla: coevolution, genomic conflict, and constraint. Genome Res. 2004;14:802–811. - PMC - PubMed

Publication types