

The role of standard automated perimetry and newer functional methods for glaucoma diagnosis and follow-up
- PMID: 21150035
- PMCID: PMC3038506
- DOI: 10.4103/0301-4738.73694
The role of standard automated perimetry and newer functional methods for glaucoma diagnosis and follow-up
Abstract
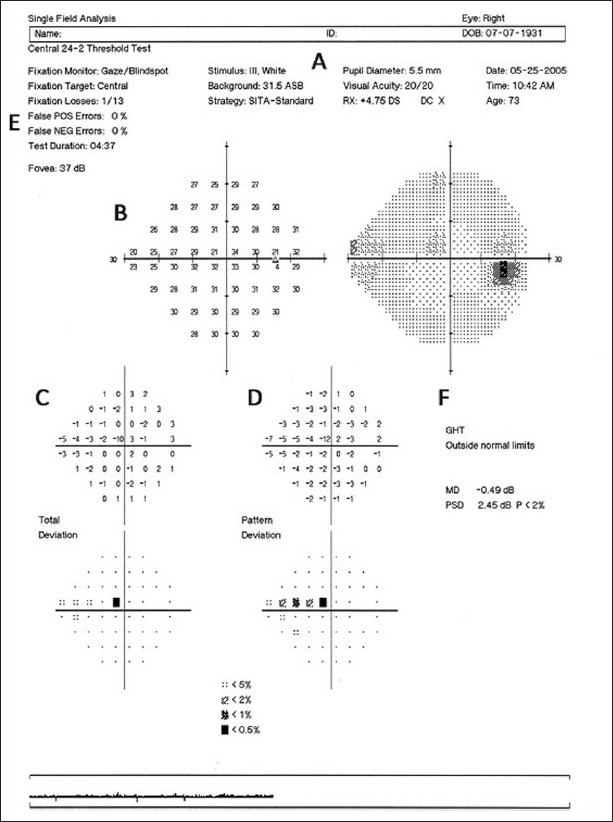
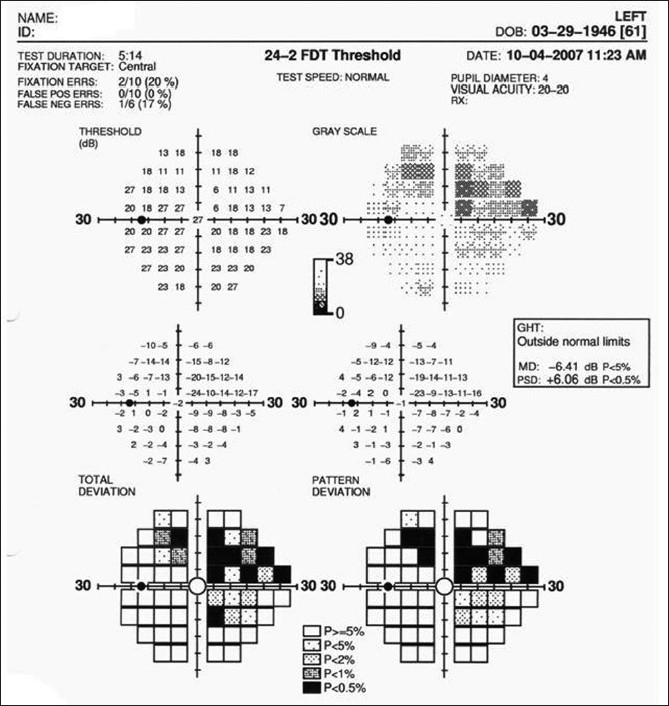
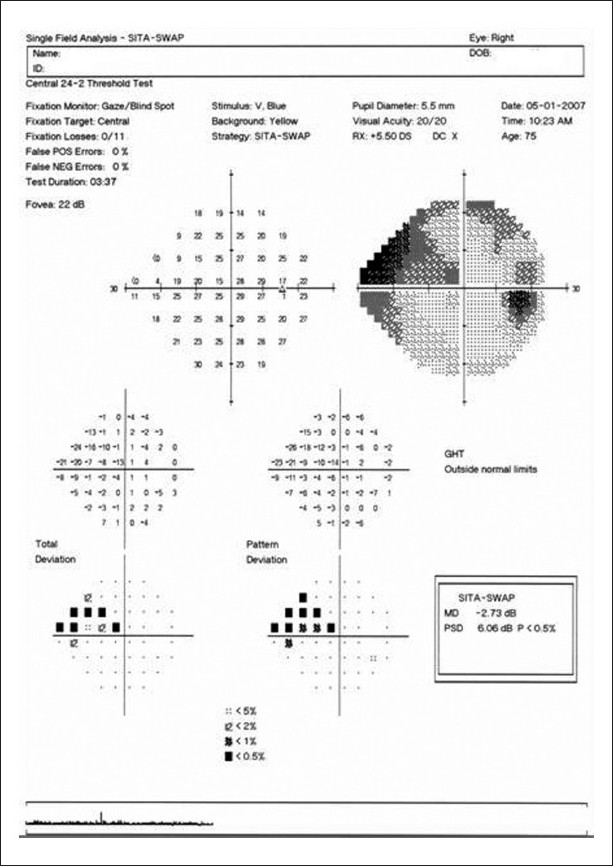
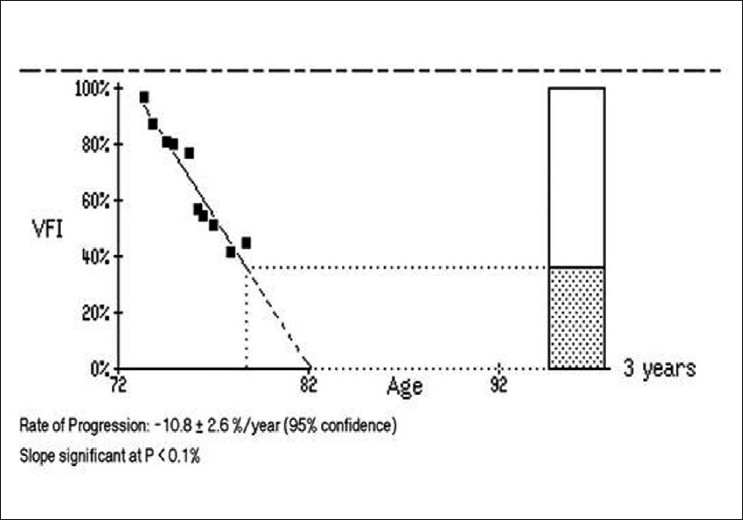
Automated perimetry has become the mainstream for assessment of functional glaucomatous loss and progressive damage. Recent improvements with the Swedish interactive thresholding algorithm (SITA) strategy and the guided progression analysis (GPA) have further settled standard achromatic perimetry (SAP) as the preferred method for diagnosis and follow-up of functional loss. Although SAP is still considered the gold standard, function-specific perimetry may offer advantages for early diagnosis. Frequency doubling technology (FDT) and short-wavelength automated perimetry (SWAP) have been shown to be helpful, especially when SAP is normal and there is a suspicion of glaucoma. Studies using rarebit perimetry have also shown promising results. Studies have observed that each test identifies a different subset of eyes, and combining the tests may improve sensitivity. Nevertheless, the more sophisticated analyses do not reduce the importance of a correct interpretation of the test results.
Conflict of interest statement
Figures
References
-
- Kelly DH. Nonlinear visual responses to flickering sinusoidal gratings. J Opt Soc Am. 1981;71:1051–5. - PubMed
-
- Quaid PT, Simpson T, Flanagan JG. Monocular and dichoptic masking effects on the frequency doubling illusion. Vision Res. 2004;44:661–7. - PubMed
-
- Anderson RS. The psychophysics of glaucoma: improving the structure/function relationship. Prog Retin Eye Res. 2006;25:79–97. - PubMed
-
- White AJ, Sun H, Swanson WH, Lee BB. An examination of physiological mechanisms underlying the frequency-doubling illusion. Invest Ophthalmol Vis Sci. 2002;43:3590–9. - PubMed
-
- Johnson CA, Keltner JL, Cello KE, Edwards M, Kass MA, Gordon MO, et al. Baseline visual field characteristics in the ocular hypertension treatment study. Ophthalmology. 2002;109:432–7. - PubMed
MeSH terms
LinkOut - more resources
Full Text Sources
Medical
Miscellaneous
