. 2011 Jan;59 Suppl(Suppl1):S59-68.
doi: 10.4103/0301-4738.73696.

Role of imaging in glaucoma diagnosis and follow-up

Affiliations

Role of imaging in glaucoma diagnosis and follow-up

Gianmarco Vizzeri et al. Indian J Ophthalmol. 2011 Jan.

Abstract

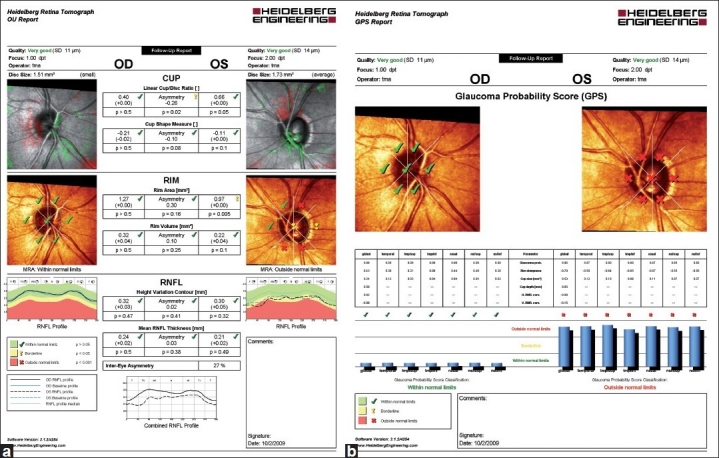
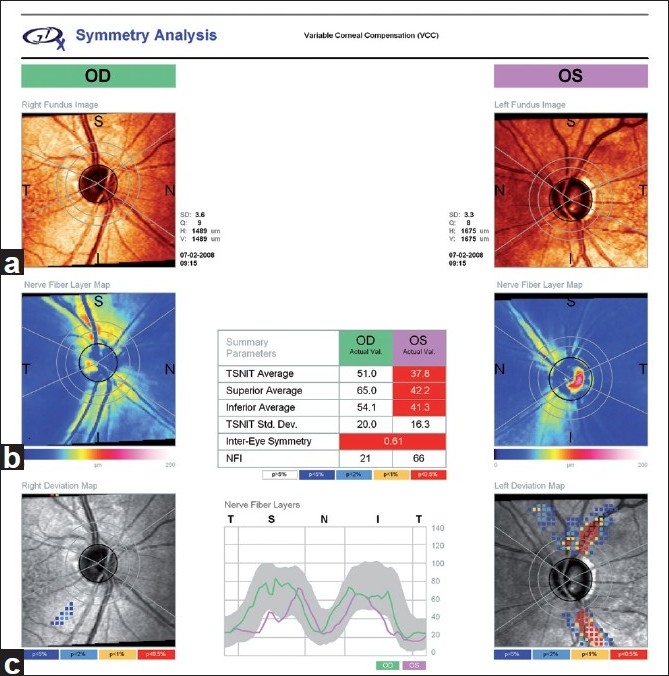
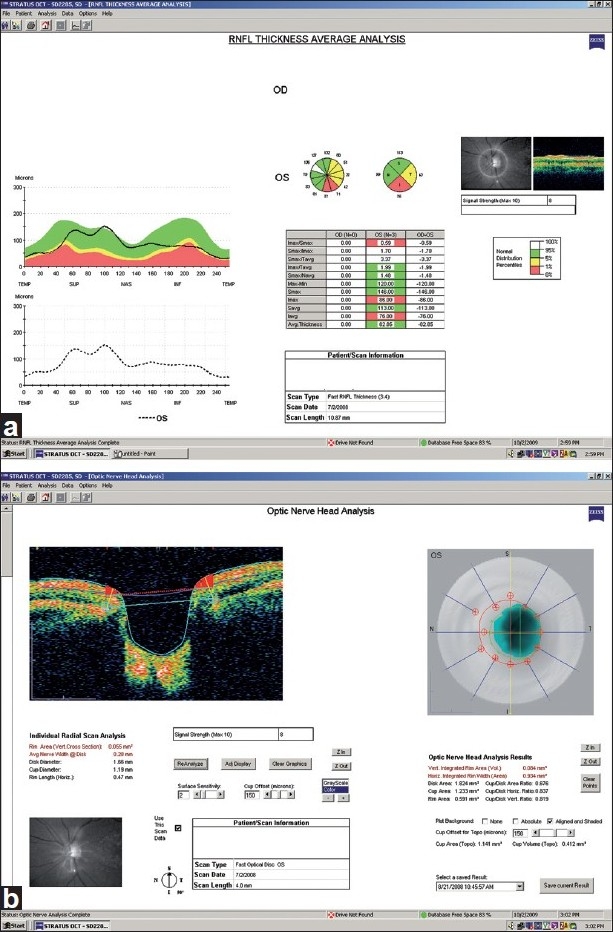
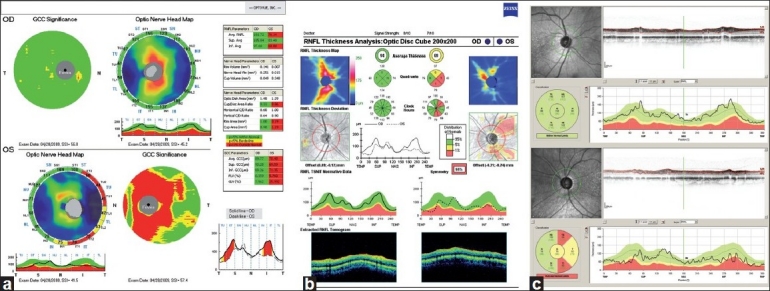
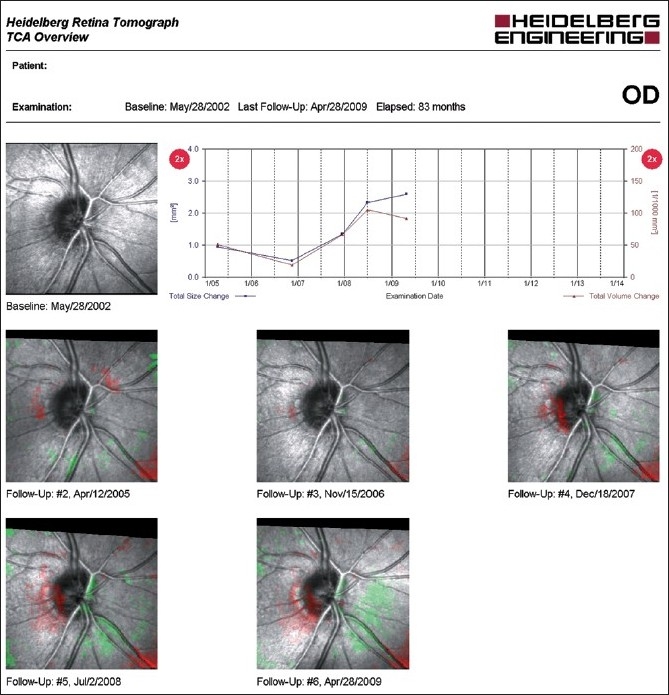
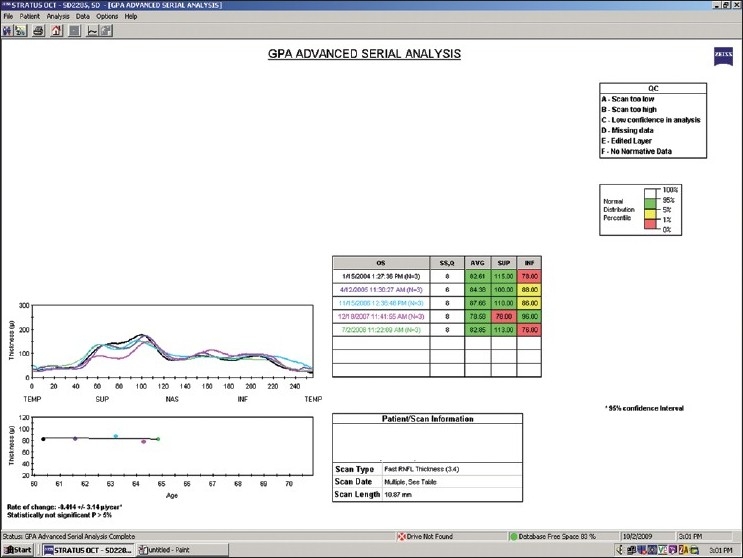
The purpose of the review is to provide an update on the role of imaging devices in the diagnosis and follow-up of glaucoma with an emphasis on techniques for detecting glaucomatous progression and the newer spectral domain optical coherence tomography instruments. Imaging instruments provide objective quantitative measures of the optic disc and the retinal nerve fiber layer and are increasingly utilized in clinical practice. This review will summarize the recent enhancements in confocal scanning laser ophthalmoscopy, scanning laser polarimetry, and optical coherence tomography with an emphasis on how to utilize these techniques to manage glaucoma patients and highlight the strengths and limitations of each technology. In addition, this review will briefly describe the sophisticated data analysis strategies that are now available to detect glaucomatous change overtime.


Conflict of interest statement

Conflict of Interest:Research support, equipment for LM Zangwill: Carl Zeiss Meditec (Dublin, CA); Heidelberg Engineering (Heidelberg, Germany); Topcon Medical Systems (Paramus, NJ Optvue Inc. (Fremont CA)

Figures

Figure 1
Figure 1
(a, b) HRT “Follow-up Report” (a) with results from the topographic change analysis (top) and the Moorfields Regression Analysis (middle). RNFL thickness measurements and inter-eye asymmetry are provided in the bottom section of the printout. HRT Glaucoma Probability Score (GPS) printout (b). The GPS classification is provided, superimposed on the optic disc image (top). Results from comparison with the internal normative database also are displayed in blue bars below. Abbreviation: RNFL: retinal nerve fiber layer
Figure 2
Figure 2
GDx VCC symmetry analysis printout displaying a fundus image of the optic nerve (a), the nerve fiber layer map in pseudo-colors (b), and the deviation map (c). VCC: variable corneal compensator
Figure 3
Figure 3
(a, b) Stratus OCT RNFL thickness average analysis (a) and optic nerve head analysis (b) of the left eye. RNFL: retinal nerve fiber layer
Figure 4
Figure 4
(a-c) Printouts from the commercially available spectral domain optical coherence tomography devices. (a) RTVue, (b) Cirrus HD-OCT, and (c) Spectralis OCT
Figure 5
Figure 5
Topographic change analysis overview of the right eye. The presence of red pixels inside the disc at three consecutive follow-up exams is indicative of glaucomatous progression. In addition, the graph shows change overtime beginning in 2008 with an increase in the total size and volume change of the superpixel cluster
Figure 6
Figure 6
GPA progression analysis for GDx of the right eye. The image progression map shows a region of “Likely Progression” in the supero-nasal quadrant. The rate of change is shown below, and it is significant for the parameter “TSNIT Average”
Figure 7
Figure 7
Stratus OCT GPA advanced serial analysis of the left eye. The rate of change of the average RNFL thickness, shown at the bottom left, is statistically not significant. Abbreviation: RNFL: retinal nerve fiber layer

References

    1. Fayers T, Strouthidis NG, Garway-Heath DF. Monitoring glaucomatous progression using a novel Heidelberg Retina Tomograph event analysis. Ophthalmology. 2007;114:1973–80. - PubMed
    1. Artes PH, Chauhan BC. Longitudinal changes in the visual field and optic disc in glaucoma. Prog Retin Eye Res. 2005;24:333–54. - PubMed
    1. Chauhan BC, Blanchard JW, Hamilton DC, LeBlanc RP. Technique for detecting serial topographic changes in the optic disc and peripapillary retina using scanning laser tomography. Invest Ophthalmol Vis Sci. 2000;41:775–82. - PubMed
    1. Chauhan BC, Hutchison DM, Artes PH, Caprioli J, Jonas JB, Leblanc RP, et al. Optic Disc Progression in Glaucoma. Comparison of Confocal Scanning Laser Tomography to Optic Disc Photographs in a Prospective Study. Invest Ophthalmol Vis Sci. 2008;50:1682–91. - PubMed
    1. Bowd C, Balasubramanian M, Weinreb RN, Vizzeri G, Alencar LM, O’Leary N, et al. Performance of confocal scanning laser tomograph Topographic Change Analysis (TCA) for assessing glaucomatous progression. Invest Ophthalmol Vis Sci. 2009;50:691–701. - PMC - PubMed