. 2010;70(4):269-77.
doi: 10.1159/000321967. Epub 2010 Dec 8.

The meaning of interaction

Affiliations

The meaning of interaction

Xuefeng Wang et al. Hum Hered. 2010.

Abstract

Although recent studies have attempted to dispel the confusion that exists in regard to the definition, analysis and interpretation of interaction in genetics, there still remain aspects that are poorly understood by non-statisticians. After a brief discussion of the definition of gene-gene interaction, the main part of this study addresses the fundamental meaning of statistical interaction and its relationship to measurement scale, disproportionate sample sizes in the cells of a two-way table and gametic phase disequilibrium.


Figures

Fig. 1
Fig. 1
Conceptual model of physical genegene interaction. Most methods of detecting gene-gene interaction still rely on examining the relationship between phenotype and marker genotypes, where all the intermediate processes (the region enclosed by a dashed line) are treated as a black-box. However, physical interaction can occur at any stage, between any functional sequences/molecules. Although DNA-DNA interactions do exist, it is mostly the interactions between gene products that alter the final phenotypes, such as protein-protein, protein-DNA and protein-RNA interactions, each providing a new point of entry into understanding the complex physico-chemical gene-gene interaction system.
Fig. 2
Fig. 2
No interaction. a Left: a 2 × 2 table in each cell of which we expect a quantitative outcome; right: mean values that exhibit no interaction. b Lack of interaction is characterized by two parallel lines. c General r × c table; there is no interaction if there is ‘diagonal equality’ for all possible ‘rectangle corners’ (μii + μjj = μij + μji – the corners of two such rectangles are highlighted).
Fig. 3
Fig. 3
Removable interaction. Non-parallel lines in a and b indicate removable interactions. Because the slope of the upper line is greater than the slope of the lower line, a is often referred to as synergistic interaction. Interactions in a and b, where the lines have slopes of the same sign and do not cross throughout the ranges considered, can be removed by changing the response scale.
Fig. 4
Fig. 4
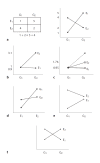
Non-removable interaction. a Simple example of crossover interaction with crossed lines. b ‘Crossover’ model used in Chatterjee et al. [13], where the response is the relative risk given the genotypes of two causal loci. Their simulations demonstrated that such a type of interaction can be detected and partially removed by Tukey's 1 d.f. model of interaction. This implies that there exists a monotonic transformation that maximizes the fit of an additive model by making the lines ‘more’, but not completely, parallel. c illustrates how the original lines (dashed) are changed (solid) when we take a simple square root transformation. This may also apply to other crossover cases where main effects exist, such as the one shown in d; whenever the lines cross, however, the interaction is not completely removable. e is an alternative plot of the same situation as in d, where the lines do not cross – but note that the slopes have different signs. Whenever the slopes have different signs (d and e), interaction is not completely removable. Interaction is completely ‘non-removable’ in cases of perfectly antagonistic interaction (zero main effects), as shown in f.
Fig. 5
Fig. 5
Influence of unequal population proportions (weights) on the presence of interaction. We start (top left) with a table of cell means that shows no interaction (as in fig. 2a) and subtract the overall mean, 3, from each cell mean. If all the cells are weighted equally (unweighted) so that the OR is 1, then the main row and column effects are as shown and there is no interaction (top right). Similarly, if the weights are proportionate so that the OR is still 1, we obtain a table (bottom left) in which there is again no interaction. If, however, the weights have an OR of 1.22, we obtain a table (bottom right) in which the interaction effect is non-zero.

References

    1. Cantor RM, Lange K, Sinsheimer JS. Prioritizing GWAS results: a review of statistical methods and recommendations for their application. Am J Hum Genet. 2010;86:6–22. - PMC - PubMed
    1. Musani SK, Shriner D, Liu N, Feng R, Coffey CS, Yi N, Tiwari HK, Allison DB. Detection of gene-gene interactions in genome-wide association studies of human population data. Hum Hered. 2007;63:67–84. - PubMed
    1. Moore JH. From genotypes to genometypes: putting the genome back in genome-wide association studies. Eur J Hum Genet. 2009;17:1205–1206. - PMC - PubMed
    1. Gerstein MB, Bruce C, Rozowsky JS, Zheng D, Du J, Korbel JO, Emanuelsson O, Zhang ZD, Weissman S, Snyder M. What is a gene, post-encode? History and updated definition. Genome Res. 2007;17:669–681. - PubMed
    1. Lanctot C, Cheutin T, Cremer M, Cavalli G, Cremer T. Dynamic genome architecture in the nuclear space: Regulation of gene expression in three dimensions. Nat Rev Genet. 2007;8:104–115. - PubMed

Publication types