. 2011 Mar;46(3):187-95.
doi: 10.1097/RLI.0b013e3181f9202d.

Assessment and monitoring tumor vascularity with contrast-enhanced ultrasound maximum intensity persistence imaging

Affiliations

Assessment and monitoring tumor vascularity with contrast-enhanced ultrasound maximum intensity persistence imaging

Marybeth A Pysz et al. Invest Radiol. 2011 Mar.

Abstract

Objectives: Contrast-enhanced ultrasound imaging is increasingly being used in the clinic for assessment of tissue vascularity. The purpose of our study was to evaluate the effect of different contrast administration parameters on the in vivo ultrasound imaging signal in tumor-bearing mice using a maximum intensity persistence (MIP) algorithm and to evaluate the reliability of in vivo MIP imaging in assessing tumor vascularity. The potential of in vivo MIP imaging for monitoring tumor vascularity during antiangiogenic cancer treatment was further evaluated.

Materials and methods: In intraindividual experiments, varying contrast microbubble concentrations (5 × 10⁵, 5 × 10⁶, 5 × 10⁷, 5 × 10⁸ microbubbles in 100 μL saline) and contrast injection rates (0.6, 1.2, and 2.4 mL/min) in subcutaneous tumor-bearing mice were applied and their effects on in vivo contrast-enhanced ultrasound MIP imaging plateau values were obtained using a dedicated small animal ultrasound imaging system (40 MHz). Reliability of MIP ultrasound imaging was tested following 2 injections of the same microbubble concentration (5 × 10⁷ microbubbles at 1.2 mL/min) in the same tumors. In mice with subcutaneous human colon cancer xenografts, longitudinal contrast-enhanced ultrasound MIP imaging plateau values (baseline and at 48 hours) were compared between mice with and without antiangiogenic treatment (antivascular endothelial growth factor antibody). Ex vivo CD31 immunostaining of tumor tissue was used to correlate in vivo MIP imaging plateau values with microvessel density analysis.

Results: In vivo MIP imaging plateau values correlated significantly (P = 0.001) with contrast microbubble doses. At 3 different injection rates of 0.6, 1.2, and 2.4 mL/min, MIP imaging plateau values did not change significantly (P = 0.61). Following 2 injections with the same microbubble dose and injection rate, MIP imaging plateau values were obtained with high reliability with an intraclass correlation coefficient of 0.82 (95% confidence interval: 0.64, 0.94). In addition, in vivo MIP imaging plateau values significantly correlated (P = 0.01; R² = 0.77) with ex vivo microvessel density analysis. Tumor volumes in treated and nontreated mice did not change significantly (P = 0.22) within 48 hours. In contrast, the change of in vivo MIP imaging plateau values from baseline to 48 hours was significantly different (P = 0.01) in treated versus nontreated mice.

Conclusions: Contrast-enhanced ultrasound MIP imaging allows reliable assessment of tumor vascularity and monitoring of antiangiogenic cancer therapy in vivo, provided that a constant microbubble dose is administered.


Figures

FIGURE 1
FIGURE 1
Schematic representation of the MIP algorithm applied to consecutive imaging frames I(x,y,t) captured at 4 time points (n + 1 through n + 4). Each imaging frame (I) is represented as a function of depth (y), width (x), and time (t) at time points n through n + 4 (shown in the upper row of the figure). Each imaging frame represents an idealized snapshot of a single microbubble coursing through the imaging plane and captured at a different spatial and temporal location. Through application of the MIP algorithm (IMIP(x,y,t), shown in the lower row of the Figure), the spatial location of the microbubble persists though time and can be tracked visually on the ultrasound monitor.
FIGURE 2
FIGURE 2
Timeline of MIP ultrasound imaging and antiangiogenic treatment experiments. Seven days following subcutaneous human colon cancer cell injections in 16 mice, baseline (0 hour) ultrasound MIP imaging of xenograft tumors was performed. Six mice were randomly selected for correlation of in vivo MIP imaging plateau value with ex vivo microvessel density analysis in excised tumors. Following baseline ultrasound MIP imaging, the remaining 10 mice were divided randomly into 2 groups receiving either a single i.p. B20 anti-VEGF antibody injection (B20-treated, n = 5) or a single i.p. saline injection (nontreated, n = 5). After 48 hours, ultrasound MIP imaging was repeated and tumors were excised for ex vivo analysis.
FIGURE 3
FIGURE 3
Bar chart demonstrates that the average MIP imaging plateau values are dependent on microbubble concentration but not infusion rate. MIP imaging plateau values obtained at each microbubble concentration (5 × 10⁵, 5 × 10⁶, 5 × 10⁷ [injection 1 and injection 2], and 5 × 10⁸) and infusion rate (0.6 mL/min, 1.2 mL/min, and 2.4 mL/min) were normalized to MIP imaging plateau values obtained with 5 × 10⁵ micro-bubbles for each mouse; bars are mean ± SD. Two injections (injection 1 and injection 2) of 5 × 10⁷ were performed to assess reliability of MIP imaging measurements obtained from the same contrast agent concentration.
FIGURE 4
FIGURE 4
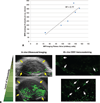
Correlation between microvessel density (MVD) and MIP imaging plateau values. A, Linear graph of data points obtained for individual mice shows good correlation between MVD and in vivo MIP imaging (R2 = 0.77; P= 0.01). B, Representative transverse in vivo ultrasound MIP images (left panel) and corresponding ex vivo CD31-stained microscopic images (100×; right panel) of 2 subcutaneous human colon cancer xenografts (yellow arrows) with different levels of tumor vascularity. Note that a low in vivo MIP imaging plateau value was associated with low ex vivo microvessel density (white arrows show CD31-positive tumor vessels) and that a high in vivo MIP imaging plateau value was associated with high ex vivo microvessel density.
FIGURE 5
FIGURE 5
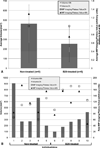
Bar charts shows average (A) and individual mouse (B) response in tumor volume (lefty-axis; blue [0 hour] and red [48 hour] bars) and MIP imaging plateau values (right y-axis; square [0 hour] and triangle [48 hour] individual points) following antiangiogenic therapy with B20 antibody or sham treatment with saline (control, nontreated). A, Bars represent the mean ± SD of tumor volumes (mm3) measured at 0 hour (blue; dark blue error bars) and 48 hours (red; pink error bars) for nontreated and B20-treated mice. Note that on average, starting tumor volumes (0 hour) were similar between nontreated and B20-treated mice; however, tumor sizes were substantially smaller at 48 hours in the B20-treated mice than the nontreated mice. Data points represent the mean ± SD of relative MIP imaging plateau values. MIP imaging plateau values for each mouse at 48 hours are expressed relative to the MIP imaging plateau at 0 hour, and then averaged for each group (nontreated and B20-treated [black dotted error bars]); note that the relative MIP imaging plateau value at 0 hour is therefore 1. Notably, MIP imaging plateau values increased in nontreated mice, but significantly decreased in B20-treated mice. B, Bars represent the raw tumor volume measured at 0 hour (blue) and 48 hours (red) for each mouse in each group (nontreated and B20-treated). Data points represent the raw MIP imaging plateau values (arbitrary intensity units) for each mouse in each group (nontreated and B20-treated).
FIGURE 6
FIGURE 6
Representative transverse in vivo ultrasound MIP images (left and middle panels) of a nontreated subcutaneous human colon cancer xenograft (yellow arrows; upper row) and of a B20-treated subcutaneous human colon cancer xenograft (yellow arrow; lower row), both imaged at baseline (0 hour) and 48 hours after a single i.p. injection of B20 anti-VEGF antibody. The in vivo MIP ultrasound imaging plateau value increased in the nontreated tumor, whereas the MIP ultrasound imaging plateau value substantially dropped in the treated tumor after 48 hours. Ex vivo CD31-immunostained micrographs (100×) obtained from the 2 tumors (right panel) confirmed higher tumor vascularity in nontreated versus B20-treated tumors.

References

    1. Rehman S, Jayson GC. Molecular imaging of antiangiogenic agents. Oncologist. 2005;10:92–103. - PubMed
    1. Jain RK. Normalizing tumor vasculature with anti-angiogenic therapy: a new paradigm for combination therapy. Nat Med. 2001;7:987–989. - PubMed
    1. Willmann JK, van Bruggen N, Dinkelborg LM, et al. Molecular imaging in drug development. Nat Rev Drug Discov. 2008;7:591–607. - PubMed
    1. Barrett T, Brechbiel M, Bernardo M, et al. MRI of tumor angiogenesis. J Magn Reson Imaging. 2007;26:235–249. - PubMed
    1. Charnley N, Donaldson S, Price P. Imaging angiogenesis. Methods Mol Biol. 2009;467:25–51. - PubMed

Publication types

MeSH terms