

EPIBLASTER-fast exhaustive two-locus epistasis detection strategy using graphical processing units
- PMID: 21150885
- PMCID: PMC3060319
- DOI: 10.1038/ejhg.2010.196
EPIBLASTER-fast exhaustive two-locus epistasis detection strategy using graphical processing units
Abstract
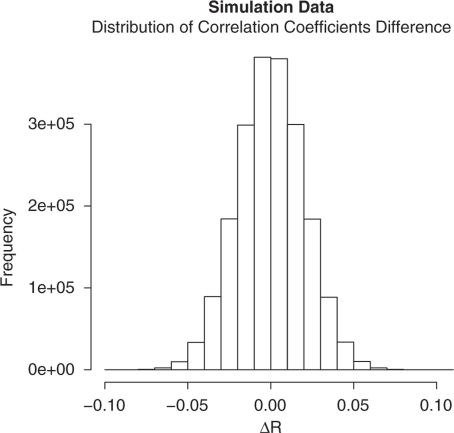
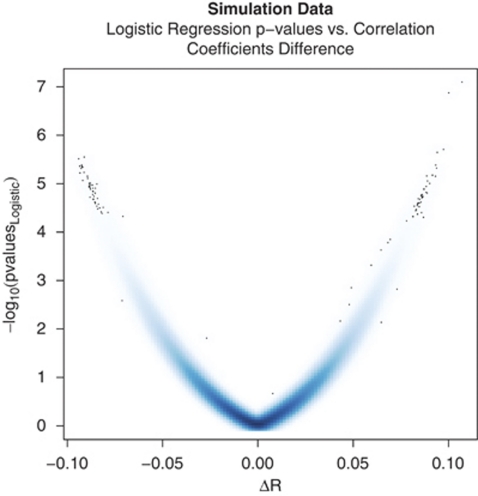
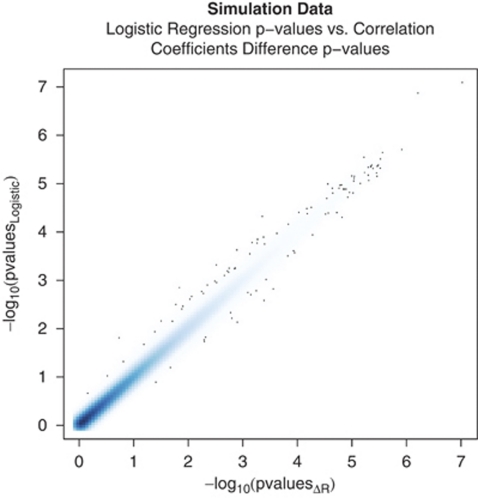
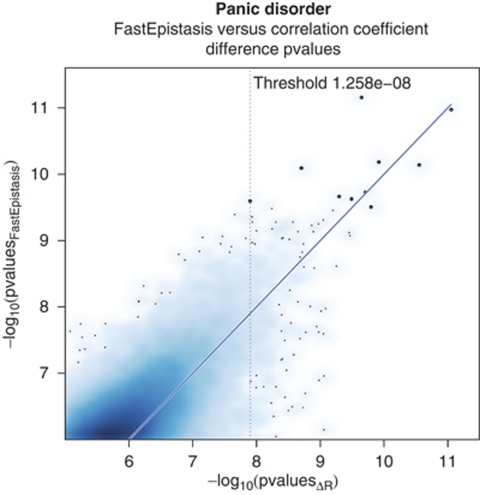
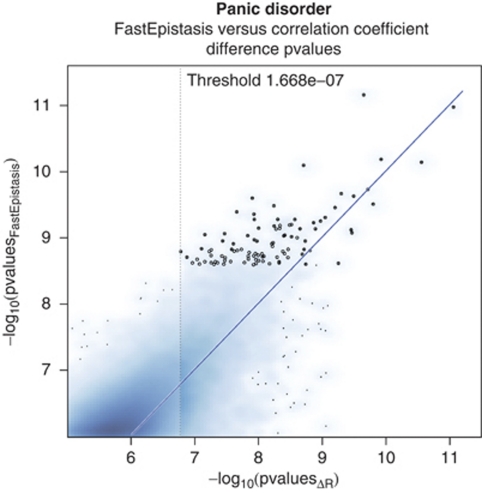
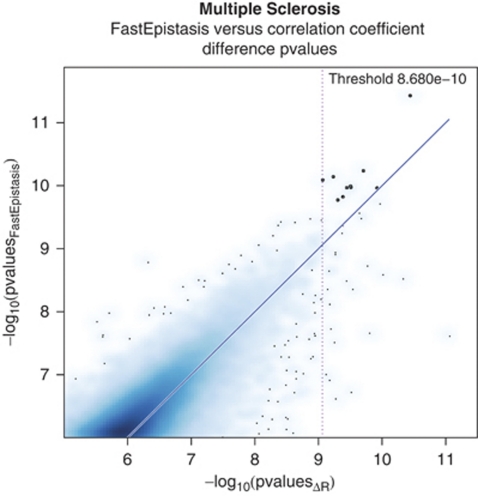
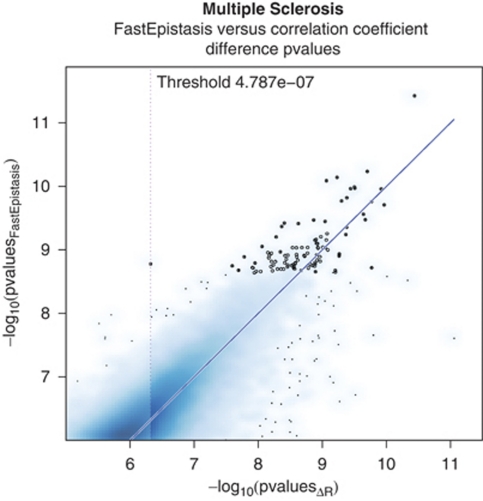
Detection of epistatic interaction between loci has been postulated to provide a more in-depth understanding of the complex biological and biochemical pathways underlying human diseases. Studying the interaction between two loci is the natural progression following traditional and well-established single locus analysis. However, the added costs and time duration required for the computation involved have thus far deterred researchers from pursuing a genome-wide analysis of epistasis. In this paper, we propose a method allowing such analysis to be conducted very rapidly. The method, dubbed EPIBLASTER, is applicable to case-control studies and consists of a two-step process in which the difference in Pearson's correlation coefficients is computed between controls and cases across all possible SNP pairs as an indication of significant interaction warranting further analysis. For the subset of interactions deemed potentially significant, a second-stage analysis is performed using the likelihood ratio test from the logistic regression to obtain the P-value for the estimated coefficients of the individual effects and the interaction term. The algorithm is implemented using the parallel computational capability of commercially available graphical processing units to greatly reduce the computation time involved. In the current setup and example data sets (211 cases, 222 controls, 299468 SNPs; and 601 cases, 825 controls, 291095 SNPs), this coefficient evaluation stage can be completed in roughly 1 day. Our method allows for exhaustive and rapid detection of significant SNP pair interactions without imposing significant marginal effects of the single loci involved in the pair.
Figures
References
-
- Marchini J, Donelly P, Cardon LR. Genome-wide strategies for detecting multiple loci that influence complex diseases. Nat Genet. 2005;37:413–417. - PubMed
-
- Wellek S, Ziegler A. A genotype-based approach to assessing the association between single nucleotide polymorphisms. Hum Hered. 2009;67:128–139. - PubMed
-
- Gretton A, Borgwardt K, Rasch B, Schölkopf B, Smola A. A kernel method for the two-sample-problem. NIPS. 2006. pp. 513–520.
-
- R Development Core Team R: A language and environment for statistical computing Vienna, Austria: R Foundation for Statistical Computing; 2009. ISBN 3-900051-07-0, , http://www.R-project.org .
Publication types
MeSH terms
LinkOut - more resources
Full Text Sources
