. 2011 Jan;8(1):91-6.
doi: 10.1038/nmeth.1543. Epub 2010 Dec 12.

Stabilized imaging of immune surveillance in the mouse lung

Affiliations

Stabilized imaging of immune surveillance in the mouse lung

Mark R Looney et al. Nat Methods. 2011 Jan.

Abstract

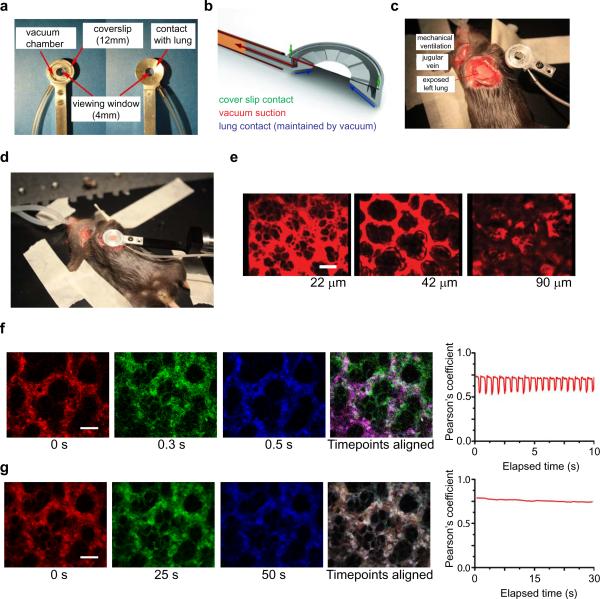
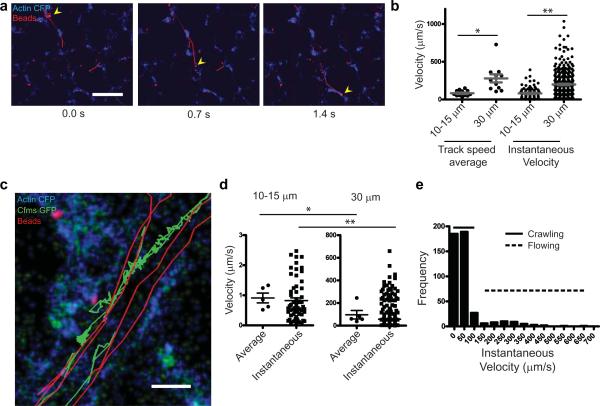
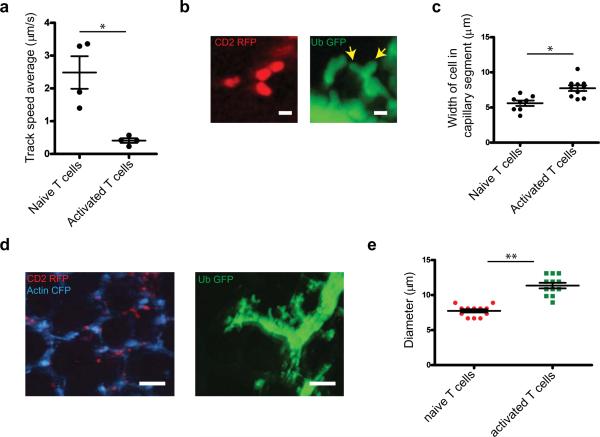
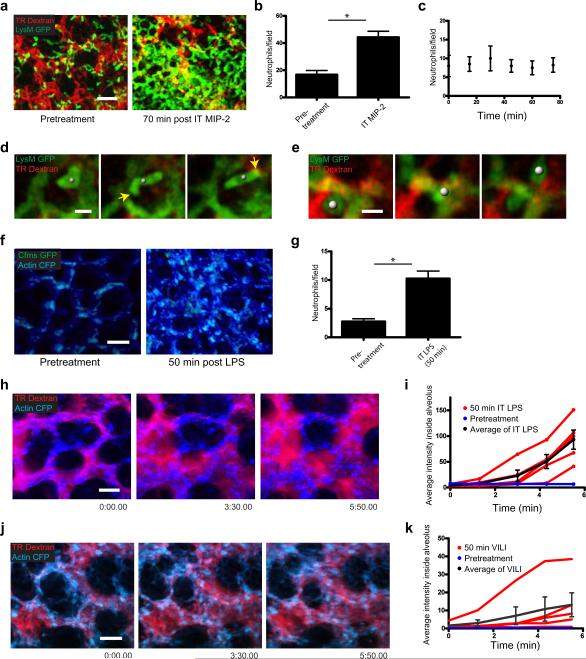
Real-time imaging of cellular and subcellular dynamics in vascularized organs requires image resolution and image registration to be simultaneously optimized without perturbing normal physiology. This problem is particularly pronounced in the lung, in which cells may transit at speeds >1 mm s(-1) and in which normal respiration results in large-scale tissue movements that prevent image registration. Here we report video-rate, two-photon imaging of a physiologically intact preparation of the mouse lung that is stabilizing and nondisruptive. Using our method, we obtained evidence for differential trapping of T cells and neutrophils in mouse pulmonary capillaries, and observed neutrophil mobilization and dynamic vascular leak in response to stretch and inflammatory models of lung injury in mice. The system permits physiological measurement of motility rates of >1 mm s(-1), observation of detailed cellular morphology and could be applied in the future to other organs and tissues while maintaining intact physiology.


Figures

Figure 1
Figure 1
Experimental setup and image stability for intravital imaging of the mouse lung. (a) Anterior and posterior views of the thoracic suction window fitted with a coverslip. (b) Side-view rendering of the suction window showing suction chamber, cover slip (green arrows) and vacuum flows (blue arrows near tissue, red arrows toward suction regulator). (c) Surgical preparation of left thorax with exposed left lung. (d) Suction window in situ. (e) Representative images at the indicated depths in a mouse injected with Texas Red dextran, showing the capillary bed above and below the subpleural alveoli (left to right). Scale bar = 50 μm (f–g) Still images of CFP fluorescence in an actin-CFP mouse lung at three time points, coded respectively as red, green and blue. Images were captured at 30 fps; in (f) each timepoint from (g) is aligned to produce a merged image. The plot shows the Pearson's coefficient from a 30 fps video over time. See also Supplementary Movie 2. (g), each frame represents 15 integrated images that are then merged (timepoints aligned). Scale bar = 50 μm. The plot shows the Pearson's coefficient over time from a video taken using the 15 integrated image acquisition. See also Supplementary Movie 3.
Figure 2
Figure 2
Perfusion velocities of beads and neutrophils in the lung. (a) The micrographs show sequential images of individual beads traversing the lung microcirculation (yellow arrow heads), in actin-CFP mice injected i.v. with red fluorescent microspheres and then imaged at 30 fps. Time elapsed after the first frame is indicated. Scale bar = 50 μm. See also Supplementary Movie 5. (b) The plot shows perfusion velocities of individual beads in small (109 ± 12 μm/s, mean ± s.e.m., n = 14) and medium-sized blood vessels (280 ± 53 μm/s, mean ± s.e.m., n = 11, P < 0.001). Instantaneous = instantaneous bead speeds. Average = average speed of individual beads. (c) The micrograph shows four representative tracks of neutrophils (green) and beads (red) inside a vessel of an Actin-CFP/c-fms+ mouse injected with fluorescent microspheres and imaged at 30 fps. Scale bar = 10 μm. (d) The plots show the average and instantaneous speed of neutrophils in small (0.91 ± 0.16 μm/s, mean ± s.e.m., n = 5) and medium-sized (96.5 ± 37.8 μm/s, mean ± s.e.m., n = 5, P < 0.05) blood vessels. (e) Histogram of neutrophil perfusion velocities in a medium-sized blood vessel. See also Supplementary Movie 6.
Figure 3
Figure 3
Perfusion velocities of T cells in the lung. (a) Track speed averages of naïve (2.48 ± 0.49 μm/s, mean ± s.e.m., n = 4) and activated T cells (0.41 ± 0.07 μm/s, mean ± s.e.m., n = 4, P < 0.01) injected into the jugular vein of actin-CFP mice are plotted. See also Supplementary Movie 7. (b) Representative images showing the morphology of naïve T cells (CD2 RFP) and T cell blasts (ubiquitin-GFP). Yellow arrows indicate a T cell blast with two leading edges, likely extending into two vascular branches. Scale bar = 10 μm. (c) Width of the capillary segments containing naïve (5.61 ± 0.39 μm, mean ± s.e.m., n = 8) and activated T cells (7.75 ± 0.41 μm, mean ± s.e.m., n = 12, P < 0.01) are plotted. (d) Still images showing the sizes of intravascular naïve (left panel) and activated (blasts; right panel) T cells. Scale bar = 50 μm, 40 μm Z stack. (e) Average diameters of naïve (7.74 ± 0.23 μm, mean ± s.e.m., n = 12) and activated T cells (11.36 ± 0.40 μm, mean ± s.e.m., n = 12, P < 0.0001).
Figure 4
Figure 4
Imaging inflammation and injury-induced neutrophil dynamics in physiologically intact lungs. (a) Images of the lung of a LysM-GFP mouse injected with Texas Red dextran and imaged before (left panel) and after (right panel) intratracheal instillation of MIP-2. Scale bar = 50 μm, 40 μm z stack. See also Supplementary Movie 8. (b) Number of GFP+ neutrophils in the imaging field before (16.75 ± 3.06 cells, mean ± s.e.m., n = 4) and after MIP-2 (44.25 ± 4.42 cells, mean ± s.e.m., n = 4, P < 0.01) instillation. (c) Number of GFP+ neutrophils in the lung vasculature under continuous suction (n = 4 for each timepoint). (d) Representative images of an intravascular GFP+ neutrophil. Scale bar = 10 μm, single z plane at 5:20, 6:40 and 9:20 min:sec. (e) Representative images of a GFP+ neutrophil moving within alveoli. Scale bar = 10 μm, single z plane at 0:40, 5:40 and 9:00 min:sec. See also Supplementary Movie 10. (f) Images of the lung of an actin-CFP/c-fms-GFP mouse before and after intratracheal instillation of LPS. Scale bar = 50 μm, 40 μm z stack. See also Supplementary Movie 11. (g) Number of neutrophils per field before (2.75 ± 0.48, mean ± s.e.m., n = 4) and after LPS instillation (10.25 ± 1.32, mean ± s.e.m., n = 4, P < 0.01). (h, j) Images of the lung of an actin-CFP mouse injected with Texas Red dextran and either challenged with intratracheal LPS for 50 minutes (h) or subjected to ventilator-induced lung injury for 60 minutes (j). Scale bar = 50 μm, 40 μm z stack. See also Supplementary Movie 12, 13. (i, k) The plots shows the average intensity of fluorescent dextran in the alveolar space at the indicated times after LPS treatment (i) or ventilator-induced lung injury (k). Blue lines are the pre-treatment average (n = 3 alveoli), red lines are individual alveoli measured post-treatment, and black lines are the post-treatment average (n = 5 alveoli).

Comment in

  • Seeing is believing.
    Bhattacharya J. Bhattacharya J. Nat Methods. 2011 Jan;8(1):57-8. doi: 10.1038/nmeth0111-57. Nat Methods. 2011. PMID: 21191375 No abstract available.

References

    1. Wiggs BR, et al. Contributions of capillary pathway size and neutrophil deformability to neutrophil transit through rabbit lungs. J. Appl. Physiol. 1994;77:463–470. - PubMed
    1. Burns AR, Smith CW, Walker DC. Unique structural features that influence neutrophil emigration into the lung. Physiol. Rev. 2003;83:309–336. - PubMed
    1. Wagner WW., Jr. Pulmonary microcirculatory observations in vivo under physiological conditions. J. Appl. Physiol. 1969;26:375–377. - PubMed
    1. Kiefmann R, Rifkind JM, Nagababu E, Bhattacharya J. Red blood cells induce hypoxic lung inflammation. Blood. 2008;111:5205–5214. - PMC - PubMed
    1. Hasegawa A, et al. Color-coded real-time cellular imaging of lung T-lymphocyte accumulation and focus formation in a mouse asthma model. J. Allergy Clin. Immunol. 125:461–468. e466. - PubMed

Publication types

LinkOut - more resources