. 2011 Jan;17(1):96-104.
doi: 10.1038/nm.2270. Epub 2010 Dec 12.

Desmoglein 2 is a receptor for adenovirus serotypes 3, 7, 11 and 14

Affiliations

Desmoglein 2 is a receptor for adenovirus serotypes 3, 7, 11 and 14

Hongjie Wang et al. Nat Med. 2011 Jan.

Abstract

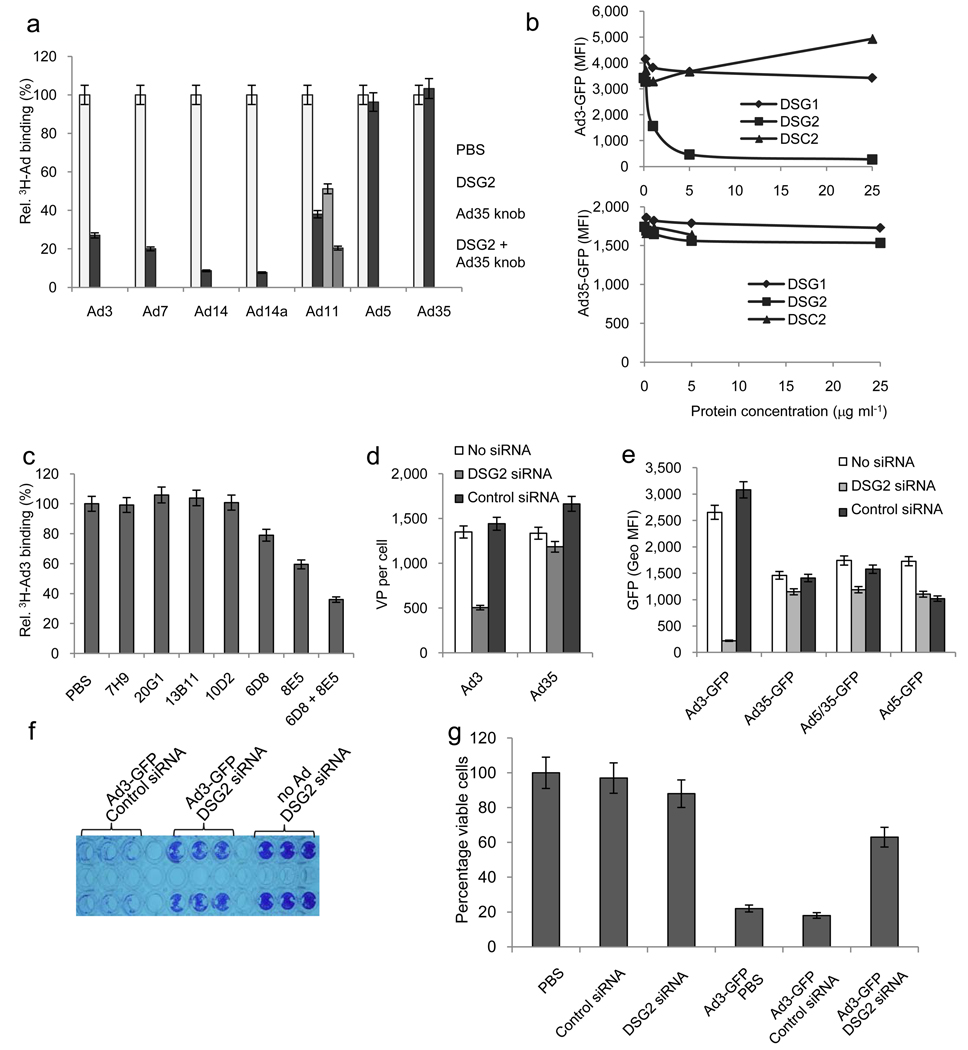
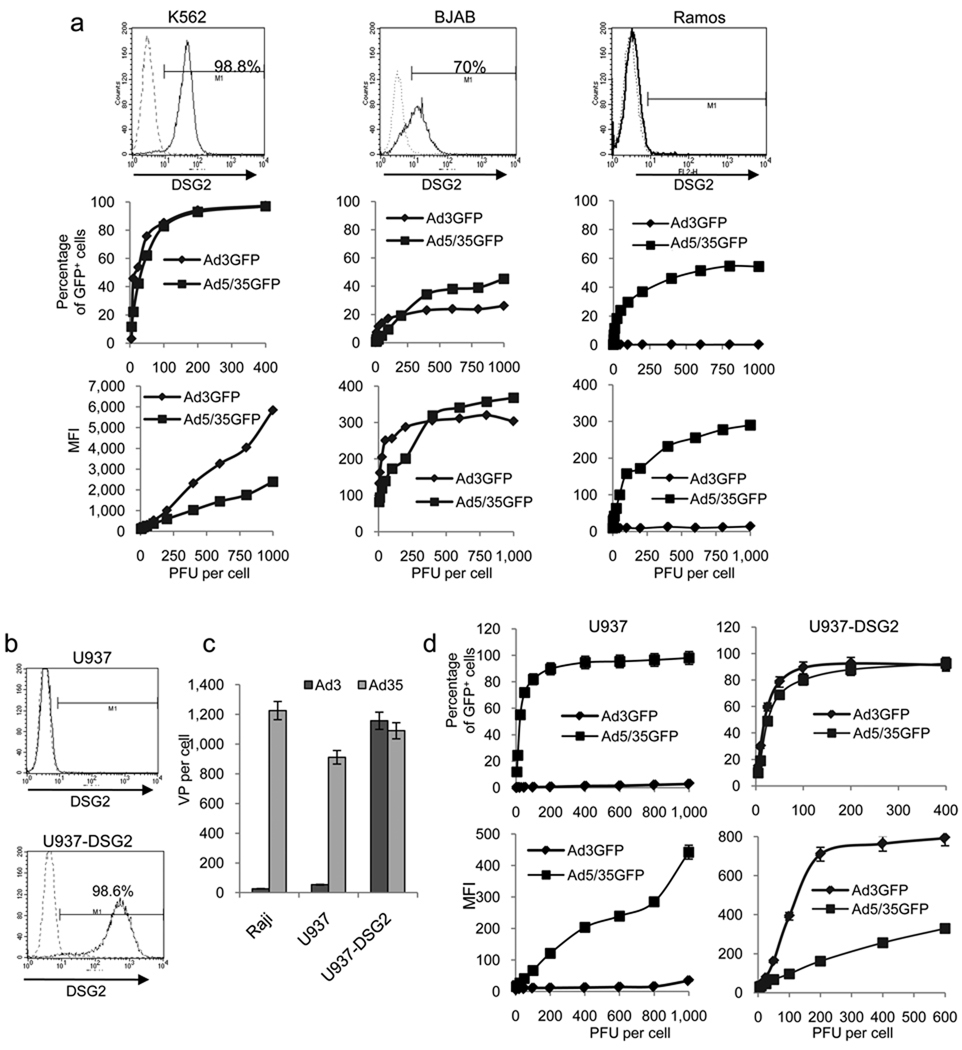
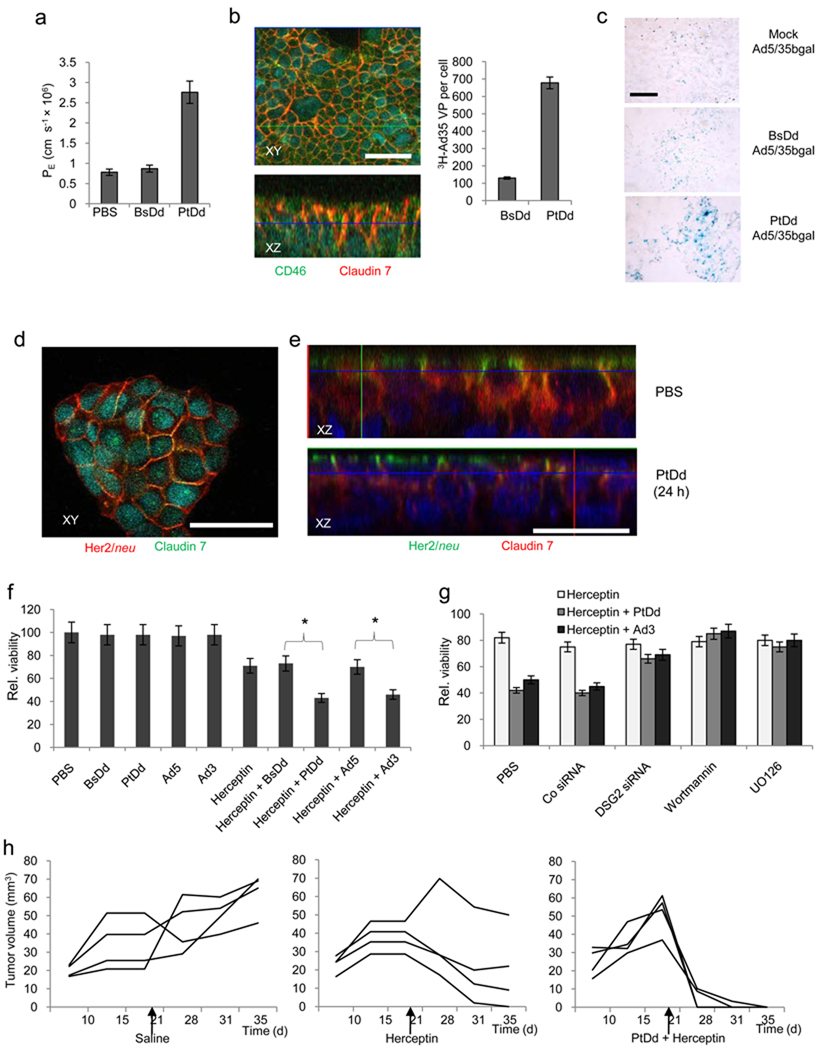
We have identified desmoglein-2 (DSG-2) as the primary high-affinity receptor used by adenoviruses Ad3, Ad7, Ad11 and Ad14. These serotypes represent key human pathogens causing respiratory and urinary tract infections. In epithelial cells, adenovirus binding of DSG-2 triggers events reminiscent of epithelial-to-mesenchymal transition, leading to transient opening of intercellular junctions. This opening improves access to receptors, for example, CD46 and Her2/neu, that are trapped in intercellular junctions. In addition to complete virions, dodecahedral particles (PtDds), formed by excess amounts of viral capsid proteins, penton base and fiber during viral replication, can trigger DSG-2-mediated opening of intercellular junctions as shown by studies with recombinant Ad3 PtDds. Our findings shed light on adenovirus biology and pathogenesis and may have implications for cancer therapy.


Figures

Fig.1
Fig.1. Identification of receptor X using Ad3 virions and Ad3 PtDd
a) Competition of 3H-labeled Ad3 and Ad5 virus attachment to HeLa cells after pre-incubation with Ad3 BsDd, PtDd, or Ad fiber knobs. Attachment in PBS-treated cells was taken as 100%. N=5. Data are represented as mean +/− SEM). Ad3-PtDd vs. Ad3 knob: p=0.0033. b) Competition of Ad3-GFP and Ad35-GFP virus infection. HeLa cells were pretreated with Ad3 fiber knob or PtDd at increasing concentrations and then exposed to Ad3-GFP (left panel) or Ad35-GFP virus (right panel) at an MOI of 100pfu/cell. GFP expression was measured 18 hours later by flow cytometry. Data are represented as mean. Standard deviation was less than 10% for all data points. c) Attachment of 3H-labeled Ad3 and Ad35 viruses to human and non-human cell lines. Y79 and Ramos are human retinoblastoma and lymphoma cells, respectively. CHO cells are Chinese Hamster ovary cells. MMC and TC1 cells are mouse mammary carcinoma and lung carcinoma cells, respectively. TC1-CD46 cells express human CD46. Shown are the average number of viral particels attached per cells. N=5. d and e) Identification of receptor X by affinity capture and MS/MS. Membrane protein fractions were prepared from HeLa and Ramos cells. Protein blots were hybridized with Ad5/35++ virions (d) and Ad3 virions or Ad3 PtDd (e). Binding was visualized with polyclonal antibodies against Ad35++ knob (d) or Ad3 knob (e) (see also Supplementary Figs. 1f and g). Solubilized HeLa cell membrane lysates were also immunoprecipitated with DSG2 mAb 6D8 crosslinked with protein A/G plus agarose. Western blot of immunoprecipitates was performed with DSG2 monoclonal antibody AH12.2 (see antiDSG2-IP). f) MS/MS analysis of the 160 kDa band. Upper panel: Structure of DSG2. EC: extracellular domain, EA: juxtamembrane extracellular anchor domain, TM: transmembrane domain. Lower panel: amino acid sequence of DSG2. Highlighted are the peptide sequences captured by MS/MS analysis of the 160 kDa band. The triangles in the DSG2 scheme (top panel) indicate the localization of the identified peptides with regards to the different domains. MS/MS analysis detected 14 peptides DSG2 with a high confidence factor (20.8% protein coverage and Sequest cross correlation coefficient scores ranging from 2.6 to 5.5 for individual peptides). g–i) Biacore plasmon surface resonance studies with recombinant human DSG2 immobilized on sensorchips. Ad2, Ad3 and Ad5 at 5.109 vp per ml (g), different concentrations of PtDd (h) or PtDd and Ad3 fiber knob (i) were injected over the activated surface and response signals were collected over the indicated time periods.
Fig.2
Fig.2. Validation of DSG2 as Ad receptor. ”Loss-of-function” studies
a) Competition of 3H-labeled Ad binding by recombinant DSG2. 3H-Ad3, Ad7, Ad14, Ad14a, Ad11, Ad5 and Ad35 virus were pre-incubated with 6 µg ml−1 recombinant human DSG2 protein. Attachment of virus particles incubated with PBS was taken as 100%. For analysis of Ad11 attachment, cells were also incubated with 50 µg ml−1 of Ad35K on ice for one hour before adding of Ad11 virus to block CD46. b) Competition of Ad transduction by recombinant DSG1, DSG2 or DSC2 proteins. c) Competition of 3H-Ad binding by DSG2-specific antibodies. n=5. PBS vs. 6D8: P=0.013; PBS vs. 8E5: P=0.0014. The specificity of mAbs to different DSG2 domains is as follows (for a scheme of DSG2, see Supplementary Fig. 1f): 20G1 (Pro-peptide region), 7H9 (Pro/EC1), 13B11 (EC1/EC2), 10D2 (EC1/EC2), 8E5 (EC3), 6D8 (EC3/EC4). d) and e) Effect of siRNA-mediated DSG2 downregulation on Ad attachment (d) and transduction (e). Shown are mean fluorescence intensity values. n=5. Note that at 18 hours post-infection, GFP levels were comparable for Ad35-GFP and Ad5/35-GFP, which allowed us to also use the first-generation Ad5/35-GFP vector in further studies. f) Cytolysis of Ad3-GFP infected BT474 cells at day 7 after infection. siRNA transfected cells were infected at adjusted MOIs that allow for comparable initial transduction rates, i.e. MOI 1.0 pfu per cell and 0.5 pfu per cell for DSG2 siRNA and control siRNA treated cells, respectively. Seven days later, viable cells were stained with crystal violet. Despite the higher virus dose, less killing was seen in cells transfected with DSG2 siRNA, suggesting the importance of DSG2 in lateral spreading of Ad3. g) Cytolysis of Ad3-GFP infected cells at day 7 after infection. siRNA transfected small airway epithelial cells were infected at adjusted MOIs. Seven days later, cell viability was measured by WST-1 assay. Viability of PBS treated cells was taken 100%. n=3. Ad3-GFP/control siRNA vs. Ad3-GFP DSG2 siRNA: P<0.001.
Fig.3
Fig.3. Validation of DSG2 as Ad receptor. “Gain-of-function” studies
a) Transduction of human cell lines that express different DSG2 levels. Human erythromyeloblastoid leukemia K562 cells and Burkitt’s B-cell lymphoma BJAB and Ramos cells were infected with Ad3-GFP and Ad5/35-GFP at increasing MOIs and GFP expression was measured 18 hours later. N=3. Standard deviation was less than 10% for all data points. b) Ectopic DSG2 expression. Human histiocytic lymphoma U937 cells were infected with a lentivirus vector carrying the DSG2 cDNA under the control of the EF1α promoter. Stable DSG2 expression was detected in >98% of lentivirus transduced cells by flow cytometry. c) Attachment of 3H-Ad3 and 3H-Ad35 to Raji, U937 and DSG2-expressing U937 (U937-DSG2) cells. Note that Ad35 attachment is mediated through CD46 and can be blocked by soluble CD46 (data not shown). d) GFP expression after transduction of U937 and U937-DSG2 cells with Ad3-GFP and Ad5/35-GFP. n=3
Fig.4
Fig.4. DSG2 localization in human epithelial cells and interaction with Ad3
a) Immunohistochemistry studies on human colon, foreskin and ovarian cancer paraffin sections with DSG2-specific antibodies. Positive staining appears in brown. b) Confocal microscopy immunofluorescence analysis of polarized human colon cancer T84 cells for DSG2 (green) and the intercellular junction protein Claudin 7 (red). Nuclei are blue. XY and XZ planes are shown. c) Ad3 binding to DSG2. T84 cells were incubated with Cy3-labeled Ad3 particles (red) for 15 minutes, washed, and subjected to confocal microscopy. The upper XZ image is a higher magnification. Note that at least two (green) DSG2 signals are associated with one (red) Cy3-Ad3 signal. d) Confocal microscopy of normal human small airway epithelial cells (not grown in Transwell chambers). Cells were incubated with Cy5-labelled PtDd for 15 min and then washed with PBS. The upper XZ panel shows co-localization of DSG2 (red) and E-cadherin (green). The lower XZ panel is the same image showing purple Cy5-PtDd signals co-localized with green E-cadherin signals. The XY panel shows purple (PtDd) and green E-cadherin channels. Thin arrows mark membrane localized PtDd, thick arrows label cytoplasmic DSG2. e) Confocal microscopy immunofluorescence analysis of human cervical carcinoma HeLa cells (upper XZ and XY panels) and HeLa cells incubated for 15 min with Cy3-Ad3 (lower XZ panel). Scale bars for all confocal microphotographs are 20 µm.
Fig.5
Fig.5. Epithelial-to-mesenchymal transition signaling induced by Ad3 virions and PtDd in epithelial cells
a–d) Phenotypic changes triggered by PtDd in breast cancer epithelial cells. 1×10⁵ BT474 cells were incubated with 50 ng of PtDd or BsDd for the indicated time and subjected to staining with antibodies. The scale bar is 20 µm in all ZY confocal images (a, b) and 40 µm in the standard immunofluorescense studies (c, d). e) Graphic demonstration of array data for up- and down-regulated genes (PtDd vs. PBS treated cells). Each dot represents one gene. f) Western blot analysis of ERK1/2-MAPK and PI3K phosphorylation analyzed 6 hours after incubation of BT474 cells with PtDd, BsDd, DSG2-specific antibodies (10D2, 13B11, or 6D8), or control antibody (anti-GAPDH) at the indicated concentrations. For pathway inhibition, cells were treated overnight with Erk1/2 inhibitor UO126 (5 µM) or PI3K inhibitor Wortmannin (2.5 µM) before PtDd was added. The efficacy of the drugs for inhibition of the specific pathway was validated in a previous study . GAPDH is used to demonstrate equal loading.
Fig.6
Fig.6. Opening of intercellular junctions in epithelial breast cancer cells by interaction of Ad3 virions or PtDd with DSG2
a) FITC-Dextran diffusion through monolayers of BT474 cells. BT474 cells cultured in transwell chamber with 0.4 µm pore size were treated with 0.5 µg ml−1 BsDd, PtDd or 2×10⁸ Ad particles per ml for 2 hours and then 4 kDa FITC-dextran was added to the apical compartment. Paracellular flux was assessed in aliquots from the apical and basal chambers. BsDd vs. PtDd: P<0.001. b) Facilitation of 3H-Ad35 uptake by PtDd. Left panel: Trapping of CD46 in intercellular junctions of T84 cells. Co-localization of CD46 and the intercellular junction protein Claudin 7 results in yellow signals. Right panel: 3H-Ad35 attachment. BT474-cells were incubated with PtDd or BsDd and 3H-Ad35 for 2 hours on ice, washed, and then incubated at 37°C for 60 min. Non-internalized Ad particles were removed by trypsin digestion and cell-associated radioactivity was measured. c) Mice carrying subcutaneous ovc316 tumors were injected intravenously with 50 µg PtDd or BsDd eight hours before intravenous injction of 1×10⁹ pfu of Ad5/35-bGal. Sections were stained with X-gal 72 hours after injection. The scale bar is 40 µm. d) Confocal microscopy for Her2/neu and Claudin 7 in the Her2/neu-positive human breast cancer cell line BT474. These cells do not form monolayers. Note that in PBS treated cells, most Her2/neu signals (green) colocalize with Claudin 7 (red) resulting in yellow signals. Upon PtDd treatment, Claudin 7 signals decrease while more Her2/neu staining appears on the cell surface. e) Confocal microscopy of BT474 cells two hours after treatment with PBS or PtDd. f) Ad3 and PtDd enhance killing of Her2/neu positive breast cancer cells by Herceptin. Viability of PBS-treated cells was taken 100%. n=5, *P<0.05. g) Ad3 and PtDd enhancement of Herceptin therapy is mediated by DSG2 and involves ERK/MAPK and PI3K pathways. BT474 cells were transfected with control and DSG2 siRNA as described in Fig. 2d and 48 hours later treated with Ad3 or PtDd and Herceptin as described in g). For inhibitor studies, BT474 cells were incubated with the indicated agents overnight. Cells were washed and treated with PtDd/Ad3 and Herceptin as described in above. n=5, PBS vs. Wortmannin, UO126: P<0.05. h) PtDd-mediated enhancement of Herceptin therapy in vivo. Shown is the tumor volume of individual mice at different days after BT474-M1 cell injection.

Comment in

References

    1. Bergelson JM, et al. Isolation of a common receptor for Coxsackie B viruses and adenoviruses 2 and 5. Science. 1997;275:1320–1323. - PubMed
    1. Tuve S, et al. A new group B adenovirus receptor is expressed at high levels on human stem and tumor cells. J Virol. 2006;80:12109–12120. - PMC - PubMed
    1. Louie JK, et al. Severe pneumonia due to adenovirus serotype 14: a new respiratory threat? Clin Infect Dis. 2008;46:421–425. - PubMed
    1. Tate JE, et al. Outbreak of severe respiratory disease associated with emergent human adenovirus serotype 14 at a US air force training facility in 2007. J Infect Dis. 2009;199:1419–1426. - PubMed
    1. Wang H, Tuve S, Erdman DD, Lieber A. Receptor usage of a newly emergent adenovirus type 14. Virology. 2009;387:436–441. - PMC - PubMed

Publication types

MeSH terms

Associated data