. 1990 Jul;38(1):72-83.

Analysis of agonist-antagonist interactions at A1 adenosine receptors

Affiliations

Analysis of agonist-antagonist interactions at A1 adenosine receptors

E Leung et al. Mol Pharmacol. 1990 Jul.

Abstract

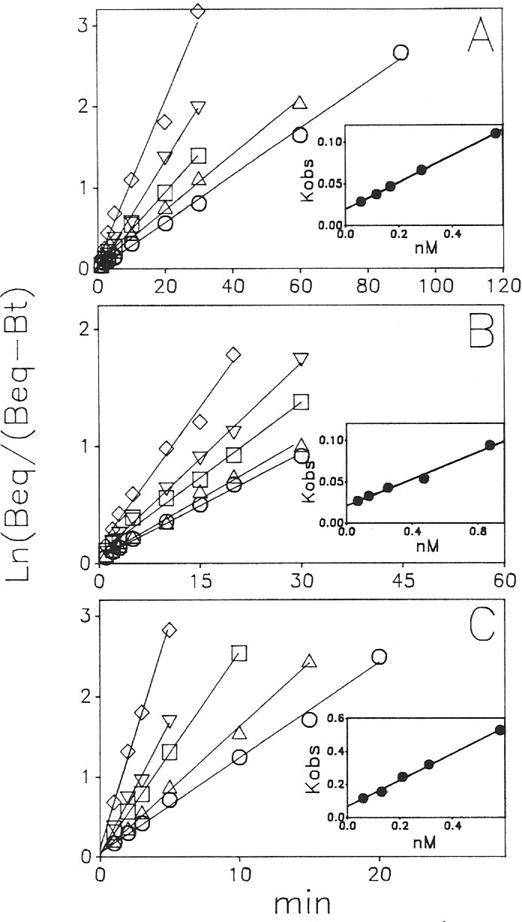
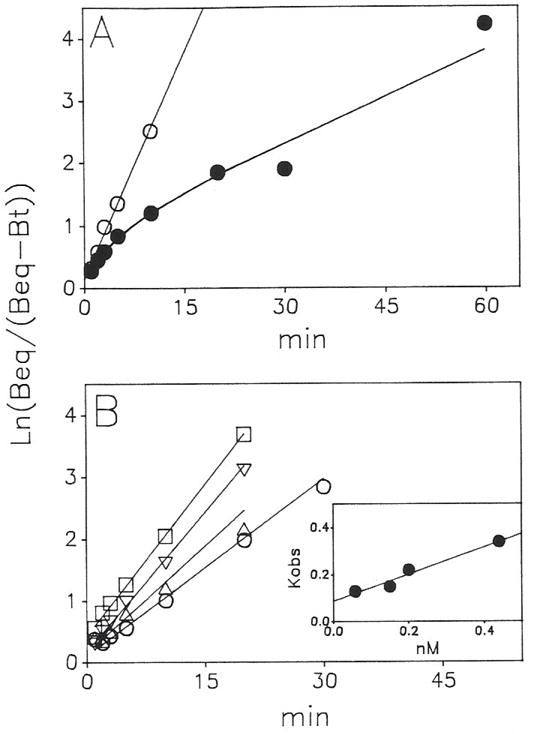
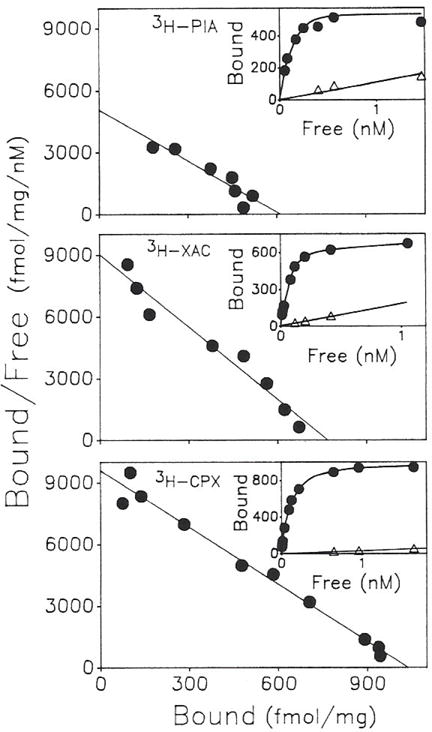
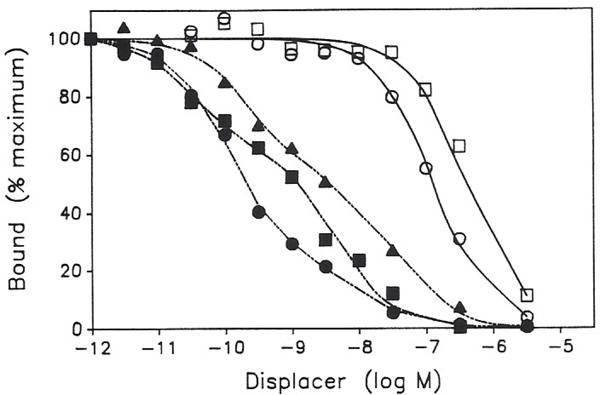
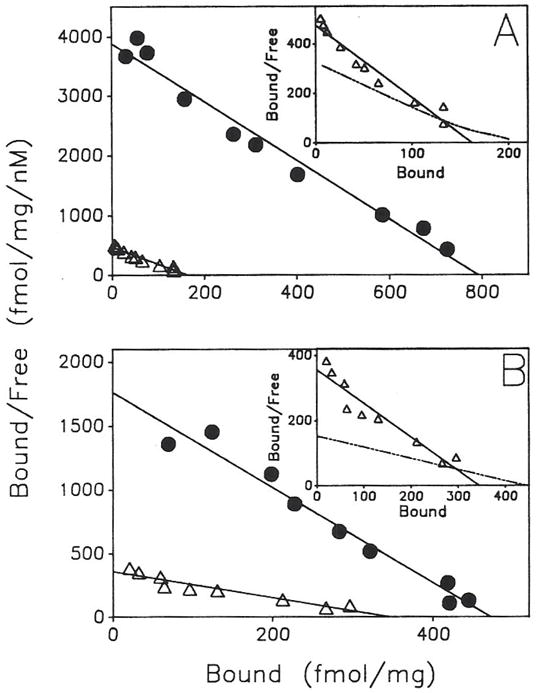
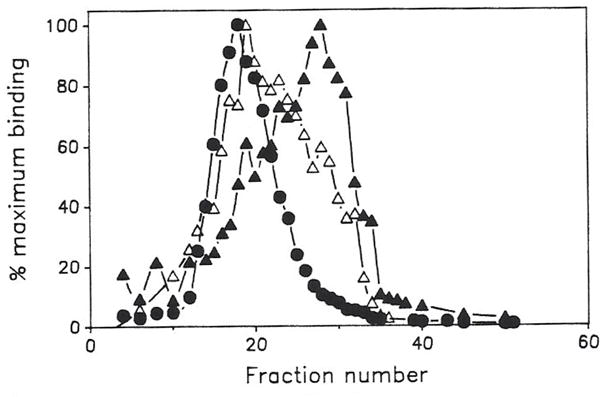
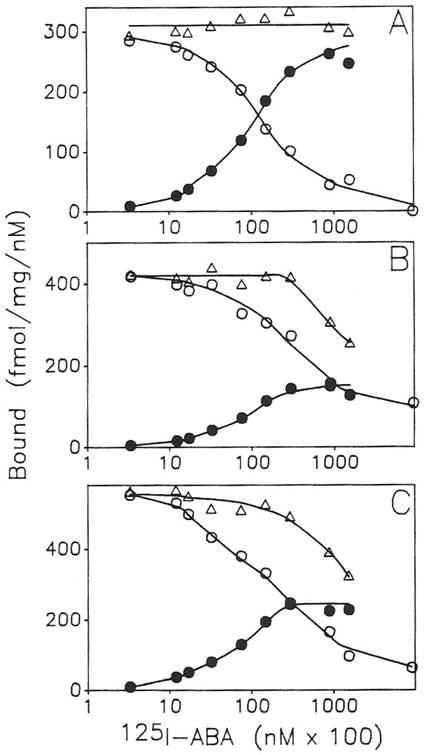
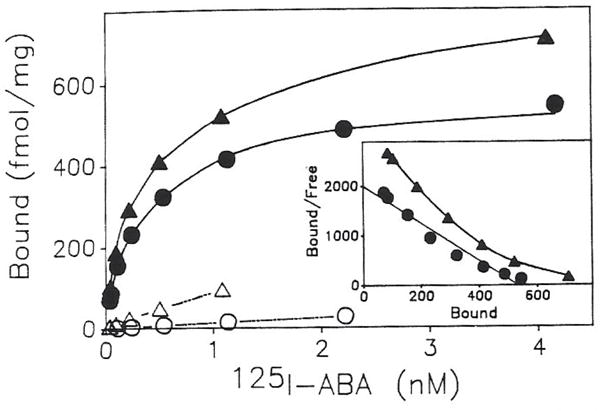
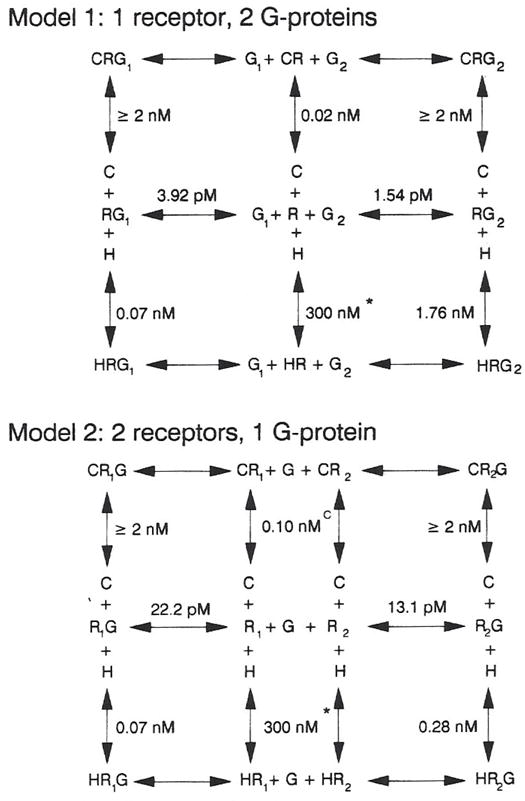
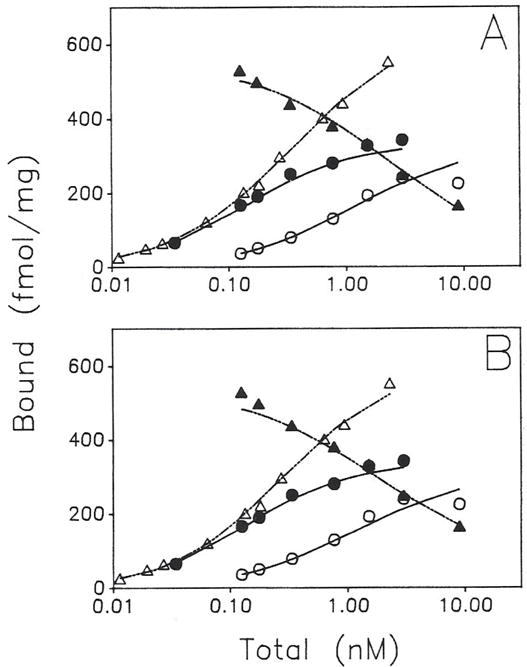
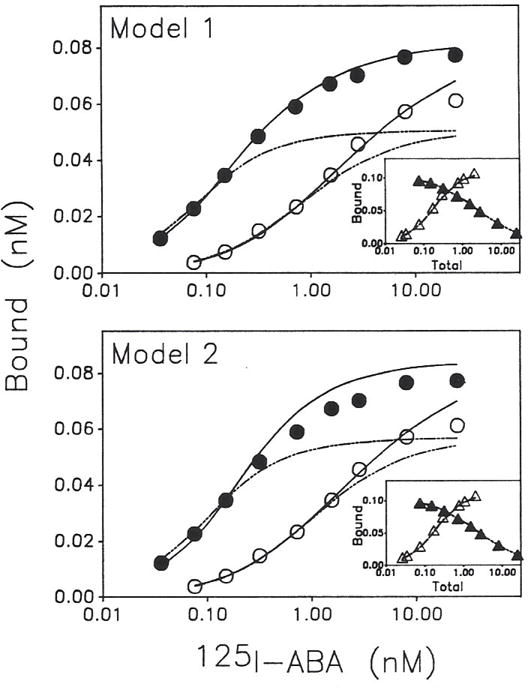
Previous work from our laboratory using sucrose gradient centrifugation and the antagonist radioligand [3H]xanthine amine congener led us to propose that A1 adenosine receptors are coupled to a GTP-binding protein (G protein) in the absence of an agonist and that adenosine receptor antagonists bind to free uncoupled receptors with high affinity and coupled receptors with low affinity and cause a destabilization of receptor-G protein complexes [Mol. Pharmacol. 36:412-419 (1989)]. Because agonists form high affinity ternary complexes composed of the agonist, receptor, and G protein, this hypothesis would imply that interactions between adenosine receptor agonists and antagonists, while competitive, would appear to be "noncompetitive" in nature. Interactions between unlabeled and radiolabeled A1 receptor agonist and antagonist ligands have been investigated using bovine cerebral cortical membranes to further probe this point. The availability of both 3H- and 125I-radioligands allowed us to use both single- and dual-isotope experimental designs. Radioligand antagonist-agonist competition curves along with saturation analyses using filtration and centrifugation to isolate bound radioligand suggested that agonists bind to two sites or receptor states with high affinity and to one site with low affinity. Agonist radioligand saturation curves with or without unlabeled antagonist suggested that antagonists do not bind to all states of the receptor with equal affinity. The computer program EQUIL was used to define models capable of simultaneously fitting all parts of complex experiments in which 125I-N6-aminobenzyladenosine saturation isotherms with or without 8-cyclopentyl-1,3-dipropylxanthine ([3H]CPX) and a saturation isotherm of [3H]CPX were performed. The data were not compatible with two-independent site models or with ternary complex models involving one receptor and one G protein. The data were fit by a model involving one receptor and two G proteins and by a model involving two receptors and one G protein. Both models suggest that 1) a high percentage of the receptor(s) is coupled to a G protein in the absence of an agonist and 2) agonists stabilize whereas antagonists destabilize precoupled receptor-G protein complexes. Because of this, competitive interactions between A1 agonists and antagonists appear noncompetitive in nature.


Figures

Fig. 1
Fig. 1
Time course of (R)-[3H]PIA (A), 125I-ABA (B). and [3H]CPX (C) binding to adenosine receptors in bovine cerebral cortical membranes. Main panels, semilogarithmic rate plots of specific [3H]PIA binding at 0.06 (○), 0.12 (△), 0.17 (□). 0.29 (▽), and 0.56 nM (◇) (A), 125I-ABA binding at 0.06 (○), 0.13 (△), 0.25 (□), 0.45 (▽), and 0.87 nM () (B), and [3H]CPX binding at 0.06 (○), 0.13 (△), 0.21 (□). 0.31 (▽), and 0.58 nM (◇) (C). Insets, plots of kobs versus ligand concentrations. Values for k−1 (intercept of the secondary plot), k+1 (slope of the secondary plot), and Keq, (k−1/k+1) were 0.019 min−1, 0.165 nM−1 min−1, and 0.12 nM for (R)-[3H]PlA; 0.021 min−1, 0.122 nM−1 min−1, and 0.17 nM for 125I-ABA; and 0.067 min−1, 0.802 nM−1 min−1, and 0.084 nM for [3H]CPX.
Fig. 2
Fig. 2
Time course of [3H]XAC binding to adenosine receptors in bovine cortical membranes. A, time course of specific [3H]XAC binding (0.45 nM) in the absence (●) and in the presence of Gpp(NH)p (0.1 mM) (○). B, rate plots of [3H]XAC binding [0.06 (○), 0.15 (△), 0.20 (▽), and 0.40 nM (□)] to receptors in NEM-pretreated membranes. Inset, secondary plot of these data (k+1, = 0.561 nM−1 min−1,k−1, = 0.086 min−1, and Keq= 0.15 nM).
Fig. 3
Fig. 3
Binding of [3H]PIA (top), (3H]XAC (middle), and [3H]CPX (bottom) to adenosine receptors in bovine cortical membranes. The three different ligands were investigated in the same experiment. Main panels, Scatchard plots; insets, saturation isotherms of specific (●) and nonspecific binding (△). Kd and Bmax values from four such experiments are summarized in Table 1.
Fig. 4
Fig. 4
[3H]XAG-agonist inhibition curves. The concentration of [3H]XAC was 0.36 nM. For (R)-PIA, ●, control; , 0.1 mM Gpp(NH)p; and ○, NEM-pretreated membranes. For I-ABA, ■, control; and □, NEM-pretreated membranes.
Fig. 5
Fig. 5
Binding of [3H]XAC in the absence and presence of PIA (20 nM) (A) and the binding of [3H]PIA in the absence and presence of XAC (2 nm) (B). Main panels. Scatchard plots in the absence (●) and presence of competitor (Δ). Insets, Scatchard plots in the presence of competitors on enlarged scales. Dashed lines in the insets, theoretical fits based on the independent two-site model. These studies were part of the same experiment as presented in Fig. 3.
Fig. 6
Fig. 6
Sucrose density gradient profiles of membrane-labeled adenosine A1 receptors using the agonist radioligand 125I-ABA (●) and the antagonist radioligand [3H]CPX (▲) and receptors labeled by [3H]CPX after sucrose gradient centrifugation (postgradient labeling) (△). Samples for postgradient labeling were incubated with [3H]CPX (1 nM) for 20 min at 37° and harvested by filtration through polyethylenimine-soaked GF/B filters. The left side of the figure is the bottom of the gradient. The radioactivities attributable to specific binding in the peak fractions for 125I-ABA, [3H] CPX (membrane labeled), and [3H]CPX (postgradient labeled) were 34,393, 1,478, and 3,951 dpm, respectively.
Fig. 7
Fig. 7
Saturation isotherms of 125I-ABA in the presence of 2 nM [3H]PIA (A), 2.1 nM [3H]XAC (B). or 1.9 nM [3H]CPX (C). Specifically bound 125I-ABA (●), 3H-labeled competitor (○), and total ligand bound (△) are plotted against the concentrations of 125I-ABA (logarithmic scale). The lines shown were drawn visually.
Fig. 8
Fig. 8
Saturation analyses of 125I-ABA binding to adenosine receptors in bovine cortical membranes using filtration and centrifugation to separate bound and free radioligand. Main panel, saturation isotherms of specific binding (closed symbols) and nonspecific binding (open symbols) determined by centrifugation (triangles) and filtration (circles), Inset, Scatchard plots of specific 125I-ABA binding determined by the two different techniques.
Fig. 9
Fig. 9
Schematic representation of the two ternary complex models consistent with the interactions between the agonist 125I-ABA (H) and the antagonist [3H]CPX (C) at the adenosine A1 receptor in the bovine cerebral cortex. In model 1, R is the adenosine A1 receptor and G1 and G2 are the two G proteins that can couple to the receptor. In model 2, R1, and R2 are the two subtypes of A1 receptor and G is the G protein that couples to the two types of receptor. The asterisk above the dissociation constant defining the affinity of the agonist for the free receptor(s) denotes that this value was treated as a constant. In model 2, the antagonist is also constrained to bind R1, and R2 with equal affinity. The dissociation constant(S) defining the affinity of the antagonist for the coupled receptors) is shown as ≥2 nM. This value was also treated as a constant during the computer fitting and did not affect the values of the other constants as long as it was held at ≥2 nM. Initial estimates of the other dissociation constants were assigned as discussed in the text and EGUIL was allowed to fit the experimental data to give the best estimates of the dissociation constants and the concentration of the reactants. The dissociation constants shown in this figure are those determined from the analysis of the single experiment shown in Fig. 10. Table 5 gives the parameter estimates obtained by the simultaneous fit of four such experiments.
Fig. 10
Fig. 10
Plots of all data points of an experiment in which saturation isotherms of 125l-ABA alone (●) and in the presence of 1.9 nM [3H]CPX (○) and a saturation isotherm for [3H]CPX alone (△) were performed. The binding of [3H]CPX (1.9 nM) as the concentration of 125I-ABA increased is also shown (▲), Parts of this experiment were presented in Figs. 3 and 7. The fitted lines are those determined by the simultaneous analysis of all the data points by EQUIL using model 1 (A) and model 2 (B). The dissociation constants for these fits are given in Fig. 9.
Fig. 11
Fig. 11
Analysis of dual-isotope experiment ([3H]CPX and 125I-ABA) with modified versions of models 1 and 2 in which the affinity of [3H]CPX for all forms of the receptor(s) was constrained to be equal. The data are from an experiment identical to the experiment shown in Fig. 10; the same symbols are used in both figures. For clarity, the main panels show the 125l-ABA saturation isotherms with and without [3H]CPX. The fits shown are for unmodified versions (selective antagonist affinities, solid lines) and modified versions (nonselective antagonist affinities, broken lines) of models 1 and 2. The remaining parts of the experiment, along with the fits for the modified versions of the models, are shown in the insets.

Similar articles

Cited by

References

    1. Williams M, Jacobson KA. Radioligand binding assays for adenosine receptors. In: Williams M, editor. Adenosine Receptors. Human; Clifton, NJ: in press.
    1. Jarvis MF. Autoradiographic localization and characterization of brain adenosine receptor subtypes. In: Leslie FM, Altar CA, editors. Receptor Localization: Ligand Autoradiography. Alan R Liss; New York: 1988. pp. 96–111.
    1. Bruns RF, Daly JW, Snyder SH. Adenosine receptors in brain membranes: binding of N6-cyclohexyl[3H]adenosine and 1,3-diethyl-8-[3H] phenylxanthine. Proc Natl Acad Sci USA. 1980;77:5547–5551. - PMC - PubMed
    1. Schwabe U, Trost T. Characterization of adenosine receptors in rat brain by (−)[3H]N6-phenylisopropyladenosine. Naunyn-Schmiedeberg’s Arch Pharmacol. 1980;313:179–187. - PubMed
    1. Williams M, Risley EA. Biochemical characterization of putative central purinergic receptors by using 2-chloro[3H]adenosine, stable analog of adenosine. Proc Natl Acad Sci USA. 1980;77:6892–6896. - PMC - PubMed

Publication types

Substances

LinkOut - more resources