. 2010 Nov 19:4:147.
doi: 10.3389/fncom.2010.00147. eCollection 2010.

Correlation-based analysis and generation of multiple spike trains using hawkes models with an exogenous input

Affiliations

Correlation-based analysis and generation of multiple spike trains using hawkes models with an exogenous input

Michael Krumin et al. Front Comput Neurosci. .

Abstract

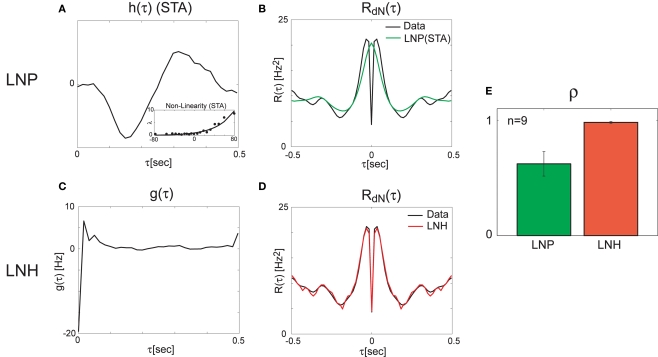
The correlation structure of neural activity is believed to play a major role in the encoding and possibly the decoding of information in neural populations. Recently, several methods were developed for exactly controlling the correlation structure of multi-channel synthetic spike trains (Brette, 2009; Krumin and Shoham, 2009; Macke et al., 2009; Gutnisky and Josic, 2010; Tchumatchenko et al., 2010) and, in a related work, correlation-based analysis of spike trains was used for blind identification of single-neuron models (Krumin et al., 2010), for identifying compact auto-regressive models for multi-channel spike trains, and for facilitating their causal network analysis (Krumin and Shoham, 2010). However, the diversity of correlation structures that can be explained by the feed-forward, non-recurrent, generative models used in these studies is limited. Hence, methods based on such models occasionally fail when analyzing correlation structures that are observed in neural activity. Here, we extend this framework by deriving closed-form expressions for the correlation structure of a more powerful multivariate self- and mutually exciting Hawkes model class that is driven by exogenous non-negative inputs. We demonstrate that the resulting Linear-Non-linear-Hawkes (LNH) framework is capable of capturing the dynamics of spike trains with a generally richer and more biologically relevant multi-correlation structure, and can be used to accurately estimate the Hawkes kernels or the correlation structure of external inputs in both simulated and real spike trains (recorded from visually stimulated mouse retinal ganglion cells). We conclude by discussing the method's limitations and the broader significance of strengthening the links between neural spike train analysis and classical system identification.

Keywords: correlation functions; integral equations; linear system identification; multi-channel recordings; point process; recurrent; retinal ganglion cells; spike train analysis.


Figures

Figure 1
Figure 1
Linear–Non-linear-Hawkes model diagram. White multivariate Gaussian noise w(t) passes through a Linear–Non-linear cascade, resulting in an exogenous input, λ(t), to the Hawkes model. By setting the Hawkes self- and mutual-excitation feedback filter to equal zero we remain with a multivariate Linear–Non-linear-Poisson (LNP) model. By setting λ(t) = λ we get the Hawkes model.
Figure 2
Figure 2
Correlation structure of the homogeneous and inhomogeneous Hawkes models can be accurately predicted Predicted theoretical correlation structure is compared to the correlation structure estimated from simulated point processes in several cases: (A) Constant λ and a refractory period-like self-exciting kernel g(τ). (B) Same as in (A), but with time-varying λ(t) that has an exponentially shaped auto-correlation function. (C) Similar to (B), but with a different self-excitation kernel g(τ). (D) Bivariate mutually exciting point processes driven by time-varying exogenous inputs with complex correlation structure. Mean values and standard deviations of the estimators were calculated from 100 simulations (each 10 min long) of corresponding Hawkes models.
Figure 3
Figure 3
System identification Any of the three different parts of the system can be identified from the other two. (A) Comparison of the input correlation structure estimated from the simulated point processes and the real values used in the simulation. (B) Hawkes kernels estimated from the simulated point processes and input correlation structure are compared to their real value used for the simulation. Mean values and standard deviations of the estimators were calculated from 100 simulations (each 10 min long) of the bivariate inhomogeneous Hawkes models from Figure 2D.
Figure 4
Figure 4
Linear–non-linear-Hawkes and LNP model fits to single-unit retinal neural spike train auto-correlations Single-unit recordings from mouse retinal ganglion cells were analyzed using the LNP and the LNH model-based approaches with the LNH model succeeding to explain the spike trains’ correlations much better than the LNP model. (A) Linear filter h(τ) and the non-linearity estimated using reverse-correlation approach (spike triggered average). (B) The expected output auto-correlation function of the LNP model calculated from the parameters in (A) does not fit the actual auto-correlation function of the spike train well. (C) The self-excitation kernel g(τ) of the LNH model shows strong refractoriness that cannot be explained by the LNP model. (D) The LNH model output auto-correlation precisely fits the actual spike train auto-correlation measured from the data. (E) The correlation coefficients between the model and the actual output auto-correlation functions are significantly (p = 0.005) higher for the LNH model (with mean ± SE of ρLNP = 0.62 ± 0.11 and ρLNH = 0.98 ± 0.01, n = 9).

References

    1. Bremaud P., Massoulie L. (2002). Power spectra of general shot noises and Hawkes point processes with a random excitation. Adv. Appl. Probab. 34, 205–22210.1239/aap/1019160957 - DOI
    1. Brette R. (2009). Generation of correlated spike trains. Neural. Comput. 21, 188–21510.1162/neco.2009.12-07-657 - DOI - PubMed
    1. Brillinger D. (1988). Maximum likelihood analysis of spike trains of interacting nerve cells. Biol. Cybern. 59, 189–20010.1007/BF00318010 - DOI - PubMed
    1. Brillinger D. R. (1975). The identification of point process systems. Ann. Probab. 3, 909–92410.1214/aop/1176996218 - DOI
    1. Brillinger D. R., Bryant H. L., Segundo J. P. (1976). Identification of synaptic interactions. Biol. Cybern. 22, 213–22810.1007/BF00365087 - DOI - PubMed

LinkOut - more resources