. 2010 Dec 1;3(6):362-72.
doi: 10.1593/tlo.10190.

Human Lymphatic Architecture and Dynamic Transport Imaged Using Near-infrared Fluorescence

Affiliations

Human Lymphatic Architecture and Dynamic Transport Imaged Using Near-infrared Fluorescence

John C Rasmussen et al. Transl Oncol. .

Abstract

Background: Although the importance of lymphatic function is well recognized, the lack of real-time imaging modalities limits our understanding of its role in many diseases. In a phase 0 exploratory study, we used dynamic, near-infrared (NIR) fluorescence imaging to assess the extremes of lymphatic architecture and transport in healthy human subjects and in subjects clinically diagnosed with unilateral lymphedema (LE), a disease that can be prevalent in cancer survivors.

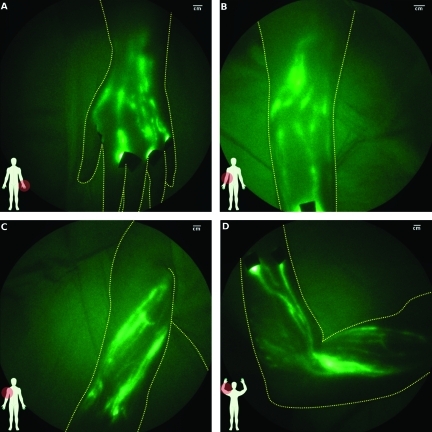
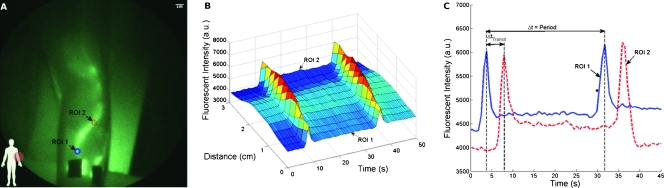
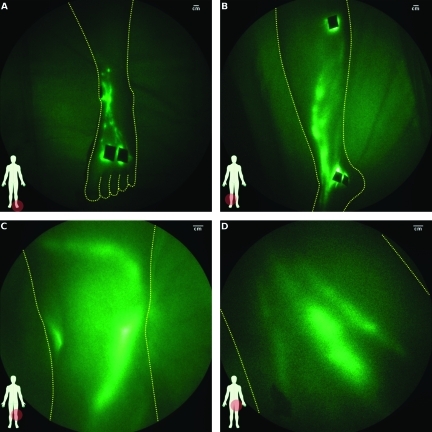
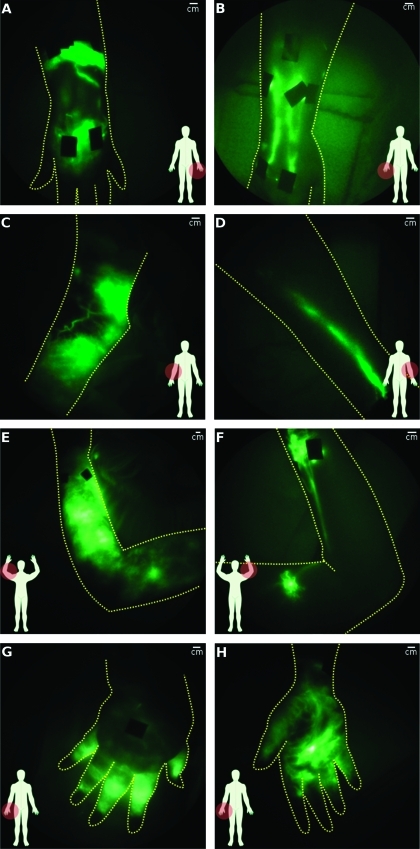
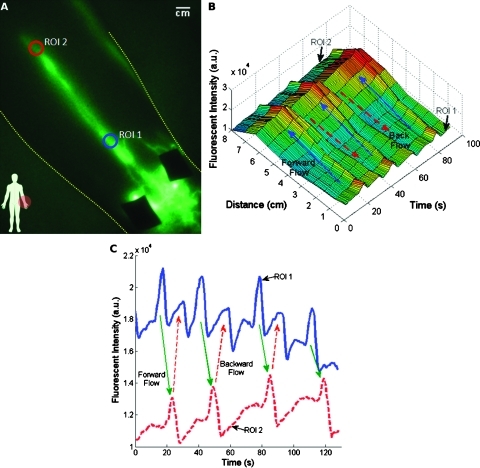
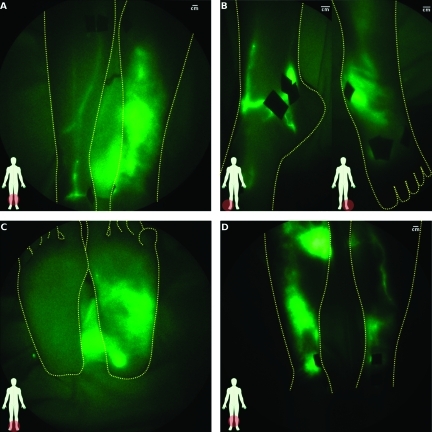
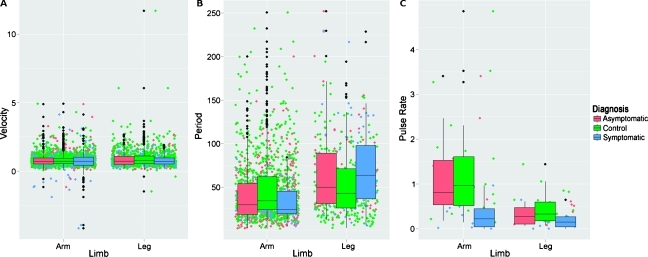
Methods and results: Active lymphatic propulsion was imaged after intradermal injections of 25 µg of indocyanine green (total maximum dose ≤400 µg) bilaterally in the arms or legs of control and subjects. Images show well-defined lymphatic structures with propulsive dye transport in limbs of healthy subjects. In LE subjects, we observed extravascular dye accumulation, networks of fluorescent lymphatic capillaries, and/or tortuous lymphatic vessels in all symptomatic and some asymptomatic limbs. Statistical models indicate that disease status and/or limb significantly affect parameters of apparent lymph propagation velocity and contractile frequency.

Conclusions: These clinical research studies demonstrate the potential of NIR fluorescence imaging as a diagnostic measure of functional lymphatics and as a new tool in translational research studies to decipher the role of the lymphatic system in cancer and other diseases.


Figures

Figure 1
Figure 1
Images of lymphatics of control arm subjects: (A) left hand after interdigital injections (subject CA08), (B) right elbow (subject CA10, Video W1 shows typical lymphatic flow), (C) upper right arm (subject CA12), and (D) entire right arm from wrist to shoulder (subject CA12). Black spots are covered injection sites.
Figure 2
Figure 2
Quantitation of lymphatic function. Lymphatic function is quantified by analyzing the profiles of fluorescent intensity at two ROIs (A) on a medial arm of subject CA10. (B) The three-dimensional plot of fluorescent intensity as a function of time and distance illustrates the propagation of the fluorescent packet along the vessel. The distance traveled is defined as the distance between ROIs 1 and 2 in (A) and the transit time (ΔtTransit) is defined as the time lapse between corresponding intensity peaks in ROIs 1 and 2 as illustrated in (C). Period is the time lapse between successive peaks in the same ROI.
Figure 3
Figure 3
Images of lymphatics of control leg subjects: (A) left foot (subject CL09, Video W2 shows typical lymphatic flow), (B) lower leg (subject CL08), (C) back of knee (subject CL12), and (D) thigh (subject CL03).
Figure 4
Figure 4
Comparison of lymphatic architecture in symptomatic and asymptomatic arms. (A, C, and E) present images of the symptomatic arm, whereas (B, D, and F) present images of the contralateral asymptomatic arms of three subjects. (A) Symptomatic hand with extravascular fluorescence from injection sites and some networks of fluorescent lymphatic capillaries and (B) normal-looking asymptomatic hand (subject LA06). (C) Symptomatic arm with extravascular fluorescence and tortuous vessels and (D) normal-looking asymptomatic arm (subject LA08). (E) Symptomatic arm with extravascular fluorescence and (F) asymptomatic arm with fluorescent lymphatic capillaries, tortuouslymph vessels, and lymph reflux (subject LA03; Figure 6). (G) Back and (H) front of symptomatic hand in which active lymphatic propulsion was seen pushing fluid into hand (subject LA01). Bright spot on palm (H) is a spontaneous fistula or weep hole that developed to permit lymph to drain.
Figure 5
Figure 5
Lymphatic reflux. (A) A closer view of the lymph vessel with lymph reflux in the asymptomatic arm of subject LA03 seen in Figure 4F (Video W3 for visualization). In this example, there appears to be insufficient valvular function allowing a portion of each forward moving packet to drain back from ROI 2 (red) to ROI 1 (blue) as illustrated in (B) a three-dimensional plot of fluorescent intensity as a function of time and distance. By following the intensity peaks, the direction of flow is determined. (C) Fluorescent intensity profiles at ROIs 1 and 2.
Figure 6
Figure 6
Comparison of architecture in symptomatic and asymptomatic legs. (A) Lower legs of a 23-year-old woman (subject LL05) with lymphedema on the left leg (right in images). Asymptomatic limb looks normal, although it has a paucity of lymphatic vessels, whereas the symptomatic limb has diffuse extravascular fluorescence with no distinct structure. (B) A closer look at the ankles of the same subject as (A) shows that the asymptomatic limb has a tortuous vessel emanating from the injections site, whereas the symptomatic limb shows diffuse extravascular fluorescence again with perhaps a large curved lymphatic vessel just above the ankle bone. (C) Image illustrating the diffusion of dye into the symptomatic foot of the same subject. (D) Lower legs of a 65-year-old woman (subject LL10) with clinically diagnosed lymphedema on the right leg (left in image). Both symptomatic and asymptomatic legs show extensive diffuse extravascular fluorescence, although some structure is apparent in asymptomatic limb.
Figure 7
Figure 7
Box plots of (A) apparent propagation velocity, (B) period, and (C) propulsion rate as a function of limb and diagnosis. Also shown is the measurement jitter (colored dots) that illustrates the magnitude of all measurements made and the outliers (black dots).

References

    1. Swartz MA. The physiology of the lymphatic system. Adv Drug Deliv Rev. 2001;50(1–2):3–20. - PubMed
    1. Sakorafas GH, Peros G, Cataliotti L, Vlastos G. Lymphedema following axillary lymph node dissection for breast cancer. Surg Oncol. 2006;15(3):153–165. - PubMed
    1. Farncombe M, Daniels G, Cross L. Lymphedema—the seemingly forgotten complication. J Pain Symptom Manage. 1994;9(4):269–276. - PubMed
    1. Rockson SG. Lymphedema. Am J Med. 2001;110(4):288–295. - PubMed
    1. Ridner SH. Pretreatment lymphedema education and identified educational resources in breast cancer patients. Patient Educ Couns. 2006;61(1):72–79. - PubMed

LinkOut - more resources