. 2010 Jun 28:2010:814176.
doi: 10.4061/2010/814176.

Analytical Validation of a Highly Quantitative, Sensitive, Accurate, and Reproducible Assay (HERmark) for the Measurement of HER2 Total Protein and HER2 Homodimers in FFPE Breast Cancer Tumor Specimens

Affiliations

Analytical Validation of a Highly Quantitative, Sensitive, Accurate, and Reproducible Assay (HERmark) for the Measurement of HER2 Total Protein and HER2 Homodimers in FFPE Breast Cancer Tumor Specimens

Jeffrey S Larson et al. Patholog Res Int. .

Abstract

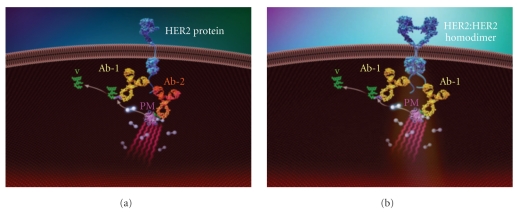
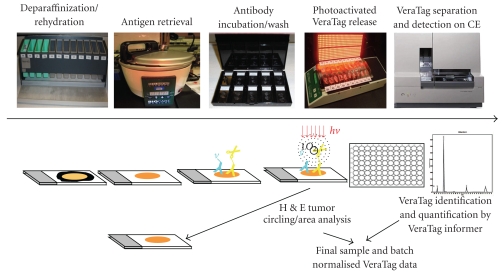
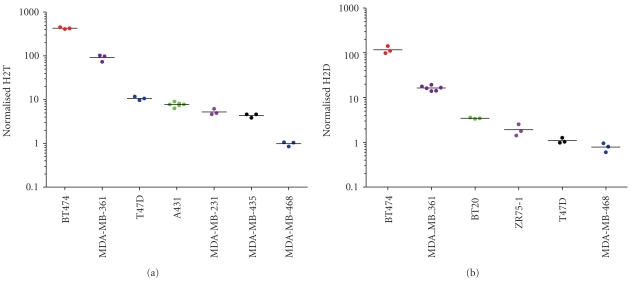
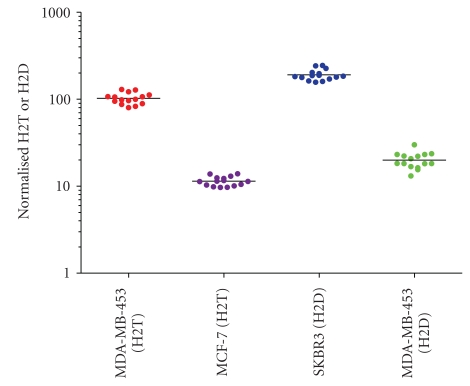
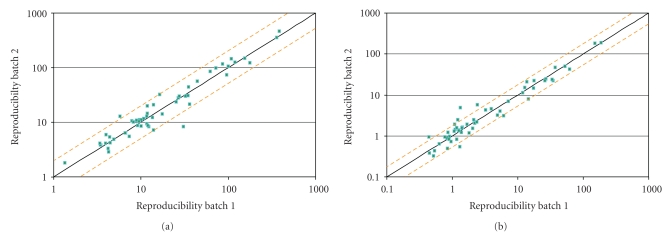
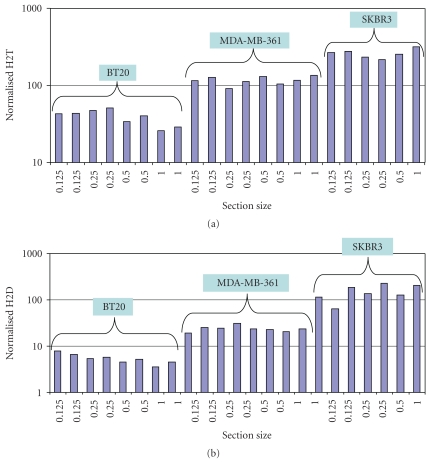
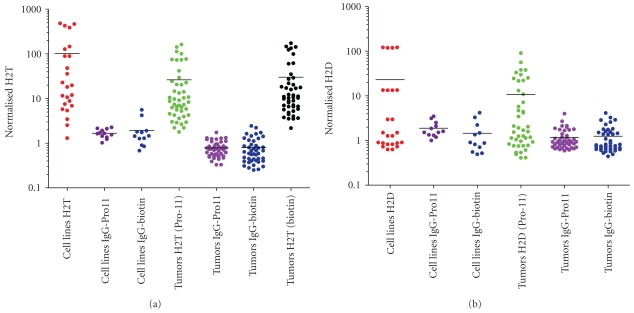
We report here the results of the analytical validation of assays that measure HER2 total protein (H2T) and HER2 homodimer (H2D) expression in Formalin Fixed Paraffin Embedded (FFPE) breast cancer tumors as well as cell line controls. The assays are based on the VeraTag technology platform and are commercially available through a central CAP-accredited clinical reference laboratory. The accuracy of H2T measurements spans a broad dynamic range (2-3 logs) as evaluated by comparison with cross-validating technologies. The measurement of H2T expression demonstrates a sensitivity that is approximately 7-10 times greater than conventional immunohistochemistry (IHC) (HercepTest). The HERmark assay is a quantitative assay that sensitively and reproducibly measures continuous H2T and H2D protein expression levels and therefore may have the potential to stratify patients more accurately with respect to response to HER2-targeted therapies than current methods which rely on semiquantitative protein measurements (IHC) or on indirect assessments of gene amplification (FISH).


Figures

Figure 1
Figure 1
Configuration of the H2T and H2D assay. (a) Configuration of the HER2 total assay consists of two antibodies specific to unique epitopes on the c-terminus of the HER2 protein. One antibody (Ab-1) is conjugated to a VeraTag molecule (V) and the other is conjugated to biotin (Ab-2). The photosensitizer molecule (PM) brings the strepavidin-methylene blue in close proximity to the antibodies. (b) Configuration of the H2D assay consists of one antibody that is specific for a unique epitope on the HER2 protein. The same antibody is conjugated either to a VeraTag (V; Ab-1) or to biotin (Ab-1). The photosensitizer molecule (PM) brings the strepavidin-methylene blue in close proximity to the antibodies.
Figure 2
Figure 2
HERmark Assay Workflow. Deparaffin/rehydration, antigen retrieval, and overnight antibody incubation steps are performed on Day 1. On day 2, the tumor tissue is incubated with the photosensitizer molecule and illuminated to release VeraTags. VeraTags are collected and separated on capillary electrophoresis and the tumors are H & E stained, tumor area identified and circled and the final sample and batch normalized data is typically available within a 7 day turnaround time.
Figure 3
Figure 3
Accuracy of the H2T and H2D assays. Seven ((a); H2T) and six ((b); H2D) different cell lines with varying levels of HER2 total protein, as measured by in house ELISA and flow cytometry, were run in the H2T assay in two separate batches. All signals showed correct rank order and accuracy based on ELISA and flow cytometry comparisons.
Figure 4
Figure 4
Precision of the HERmark assay. Fifteen replicates of each of 2 different cell lines spanning the dynamic range of the H2T and H2D assays were run in one batch for each assay to determine intra-assay variability. 95% of the values in the H2T and H2D assay are within 1.45-fold and 1.65-fold, respectively.
Figure 5
Figure 5
Reproducibility of the H2T and the H2D assay. Run 1 and run 2 represent a combination of 45 breast cancer tumors and 11 cancer cell lines assayed in two different batches. The batches were run to incorporate the following comparisons: separation by 10 days, multiple illuminators, chiller blocks, pressure cookers, and capillary electrophoresis instrument, two runs with separate lots of critical control slide reagents and critical liquid reagents. Pairwise comparisons were made on each of the separate runs. For the H2T assay 2 separate runs (a) were performed. For the H2D assay 3 separate runs were performed; results from a typical pairwise comparison are shown in (b).
Figure 6
Figure 6
Sensitivity of the H2T and H2D assays. (a) To assess the sensitivity of the H2T assay 2 different cell lines were utilized, a negative HER2 total protein cell line, MDA-MB-468, and a low HER2 receptor/cell MDA-MB-435 (IHC score of 0, see Table 2). (b) Sensitivity of the H2D assay was assessed using the negative cell line MDA-MB-468 and the low receptor cell lineT47D (IHC score of 0/1+, see Table 2).
Figure 7
Figure 7
Section size linearity of the H2T and H2D assays. (a) Cell line controls with varying levels of H2T (a) and H2D (b) were sub-sectioned and then run in the HERmark assay to determine linearity of the measurements with respect to section size. Normalized values (y-axis) show the final signals that have been corrected for size. 95.8% of the pairwise comparisons were within 1.7-fold in the H2T assay and 95% of the pairwise comparisons were with 2.2-fold for the H2D assay.
Figure 8
Figure 8
Isotype control specificity of H2T and H2D assays. All 44 tumors and 11 cell lines were tested in the regular H2T assay. Slide samples from adjacent sections were also run in an H2T assay where the anti-HER2-pro11 antibody conjugate was replaced with an IgG1-pro11 conjugate (“IgG1-pro11”) or where the anti-HER2-biotin antibody conjugate was replaced with an IgG1-biotin conjugate (“IgG1-biotin”). (a) is a graphical representation of the non-specific contribution of signal in the H2T assay whereas (b) represents the non-specific contribution of the signal in the H2D assay.
Figure 9
Figure 9
Tissue Specificity testing of the H2T and H2D assays. Tissue specificity was determined by measuring the H2T signal (a) or H2D signal (b) generated by the comparison of tumor tissue alone and with tumor tissue in addition to normal fat and stroma. 1006 = breast tumor; 878-1006-496 = breast tumor embedded with stroma and fat (a, b). 31274B2 = tumor; 272-31274B2-884 = breast tumor embedded with stroma and fat (a).

References

    1. Citri A, Skaria KB, Yarden Y. The deaf and the dumb: the biology of ErbB-2 and ErbB-3. Experimental Cell Research. 2003;284(1):54–65. - PubMed
    1. Di Fiore PP, Pierce JH, Kraus MH, Segatto O, King R, Aaronson SA. erbB-2 is a potent oncogene when overexpressed in NIH/3T3 cells. Science. 1987;237(4811):178–182. - PubMed
    1. Yarden Y, Sliwkowski MX. Untangling the ErbB signalling network. Nature Reviews Molecular Cell Biology. 2001;2(2):127–137. - PubMed
    1. Hudis CA. Trastuzumab—mechanism of action and use in clinical practice. The New England Journal of Medicine. 2007;357(1):39–51. - PubMed
    1. Ross JS, Slodkowska EA, Symmans WF, Pusztai L, Ravdin PM, Hortobagyi GN. The HER-2 receptor and breast cancer: ten years of targeted anti-HER-2 therapy and personalized medicine. Oncologist. 2009;14(4):320–368. - PubMed

LinkOut - more resources