

Noisy splicing drives mRNA isoform diversity in human cells
- PMID: 21151575
- PMCID: PMC3000347
- DOI: 10.1371/journal.pgen.1001236
Noisy splicing drives mRNA isoform diversity in human cells
Abstract
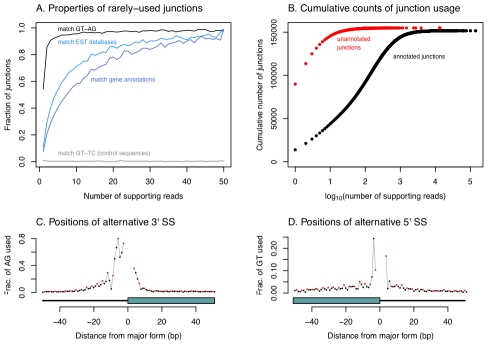
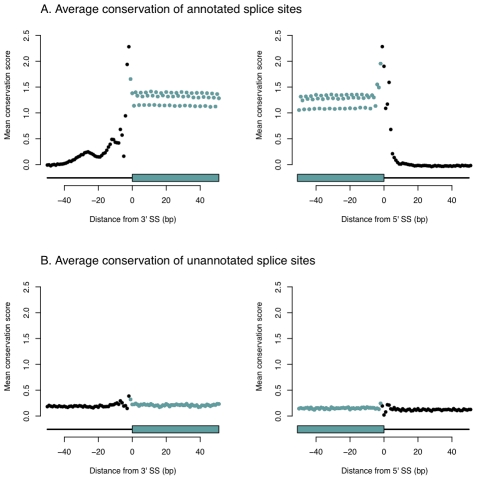
While the majority of multiexonic human genes show some evidence of alternative splicing, it is unclear what fraction of observed splice forms is functionally relevant. In this study, we examine the extent of alternative splicing in human cells using deep RNA sequencing and de novo identification of splice junctions. We demonstrate the existence of a large class of low abundance isoforms, encompassing approximately 150,000 previously unannotated splice junctions in our data. Newly-identified splice sites show little evidence of evolutionary conservation, suggesting that the majority are due to erroneous splice site choice. We show that sequence motifs involved in the recognition of exons are enriched in the vicinity of unconserved splice sites. We estimate that the average intron has a splicing error rate of approximately 0.7% and show that introns in highly expressed genes are spliced more accurately, likely due to their shorter length. These results implicate noisy splicing as an important property of genome evolution.
Conflict of interest statement
The authors have declared that no competing interests exist.
Figures
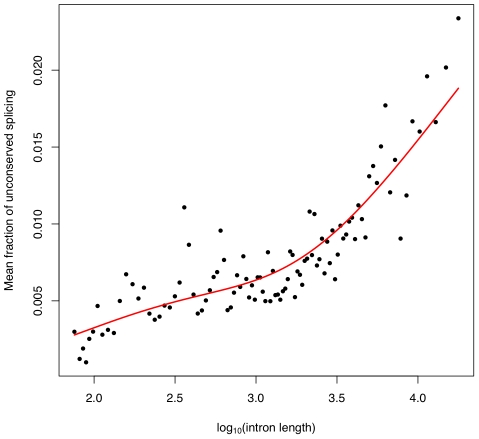
 of the mean intron length (in base pairs) of introns in the bin. In red is a spline fit to these points.
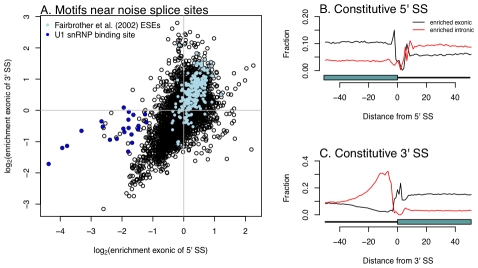
 enrichment of all possible hexamers exonic of either 5′ or 3′ noise splice sites. In light blue are hexamers identified as exonic splicing enhancers by Fairbrother et al. , and in dark blue are hexamers that are good matches to the consensus U1 snSNP binding site (we include all hexamers matching five contiguous bases of “AGGTAAG”). B and C. Hexamers from A. mark borders of constitutively spliced exons. Each point is the fraction of hexamers starting at that position relative to a constitutively spliced exon (in these cells) which match the hexamers identified as significantly enriched exonic or intronic of the “noise” 5′ or 3′ splice sites.
References
-
- Black DL. Mechanisms of alternative pre-messenger RNA splicing. Annu Rev Biochem. 2003;72:291–336. - PubMed
-
- Mortazavi A, Williams BA, McCue K, Schaeffer L, Wold B. Mapping and quantifying mammalian transcriptomes by RNA-Seq. Nat Methods. 2008;5:621–8. - PubMed
-
- Pan Q, Shai O, Lee LJ, Frey BJ, Blencowe BJ. Deep surveying of alternative splicing complexity in the human transcriptome by high-throughput sequencing. Nat Genet. 2008;40:1413–5. - PubMed
Publication types
MeSH terms
Substances
Grants and funding
LinkOut - more resources
Full Text Sources
Other Literature Sources
