. 2010 Nov 24;6(11):e1001215.
doi: 10.1371/journal.ppat.1001215.

Structural analysis of HIV-1 maturation using cryo-electron tomography

Affiliations

Structural analysis of HIV-1 maturation using cryo-electron tomography

Alex de Marco et al. PLoS Pathog. .

Abstract

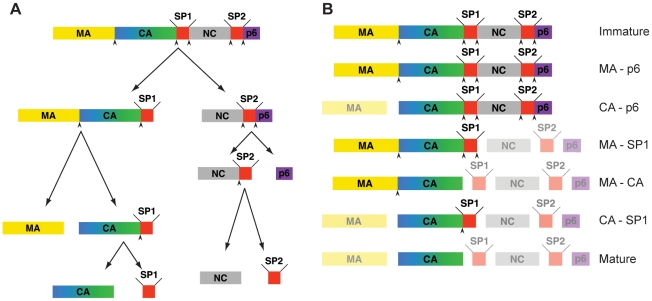
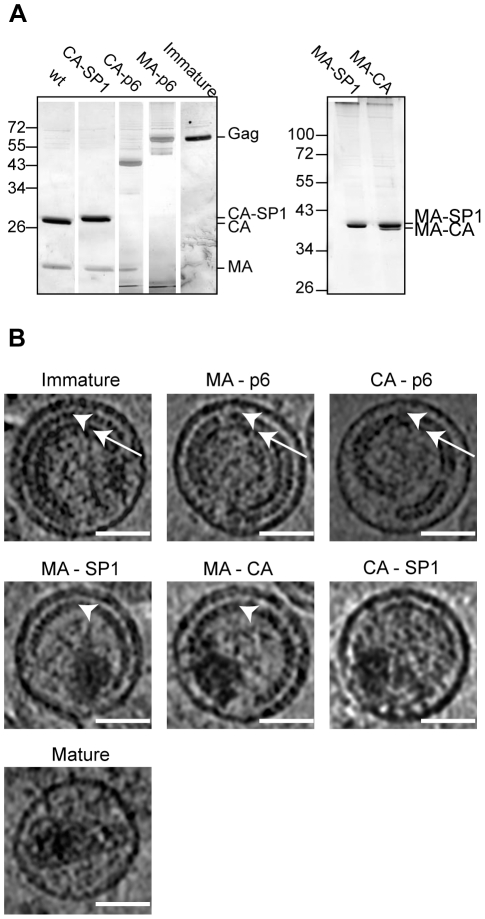
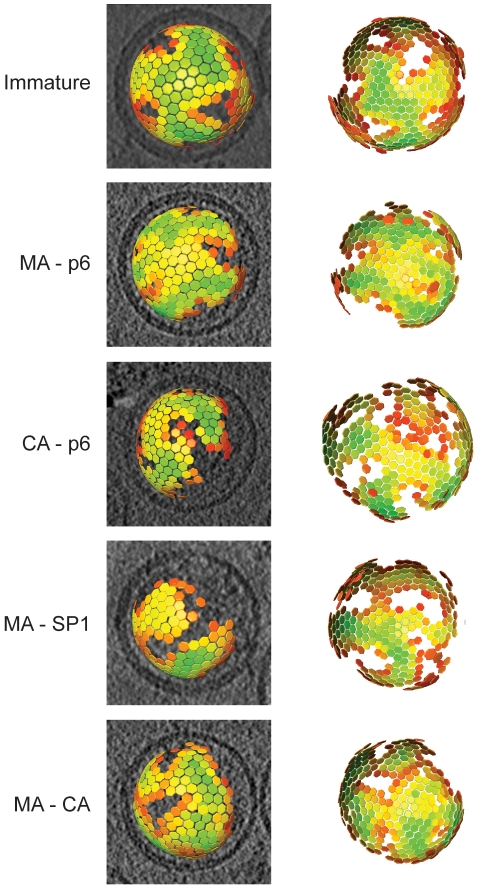
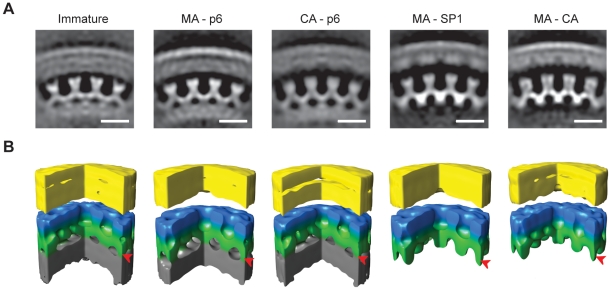
HIV-1 buds form infected cells in an immature, non-infectious form. Maturation into an infectious virion requires proteolytic cleavage of the Gag polyprotein at five positions, leading to a dramatic change in virus morphology. Immature virions contain an incomplete spherical shell where Gag is arranged with the N-terminal MA domain adjacent to the membrane, the CA domain adopting a hexameric lattice below the membrane, and beneath this, the NC domain and viral RNA forming a disordered layer. After maturation, NC and RNA are condensed within the particle surrounded by a conical CA core. Little is known about the sequence of structural changes that take place during maturation, however. Here we have used cryo-electron tomography and subtomogram averaging to resolve the structure of the Gag lattice in a panel of viruses containing point mutations abolishing cleavage at individual or multiple Gag cleavage sites. These studies describe the structural intermediates correlating with the ordered processing events that occur during the HIV-1 maturation process. After the first cleavage between SP1 and NC, the condensed NC-RNA may retain a link to the remaining Gag lattice. Initiation of disassembly of the immature Gag lattice requires cleavage to occur on both sides of CA-SP1, while assembly of the mature core also requires cleavage of SP1 from CA.


Conflict of interest statement

The authors have declared that no competing interests exist.

Figures

Figure 1
Figure 1. Steps in HIV-1 proteolytic maturation, and variants analysed.
A) Schematic outline of the proteolytic cleavages which take place in Gag during the HIV-1 maturation process. Arrowheads indicate proteolytic sites before cleavage. The order of cleavage events shown is based on the rates of cleavage in vitro as described in . B) Schematic representation of Gag after completion of cleavage for each variant analyzed. The non-cleaved products due to the inactivation of the proteolytic sites are highlighted. Mutated, and therefore uncleaved processing sites are indicated by an arrowhead.
Figure 2
Figure 2. Characterisation of HIV-1 variants.
A) Partially processed Gag-derived products detected by SDS-PAGE. Iodixanol gradient purified particle preparations of the indicated HIV-1 variants were separated on 12.5% SDS gels. Virion-associated proteins were visualized by silver staining according to standard procedures, showing MA and CA containing Gag derivatives as the most prominent bands. Lanes in the left panel were combined from two independent gels and were size adjusted for comparison. The right panel illustrates incomplete processing at the CA-SP1 boundary for variant MA-CA. Positions of molecular mass standards (in kDa) are indicated to the left. B) Central sections of 0.8 nm thickness from 6 µm defocus tomographic reconstructions of the HIV-1 variants analyzed. White arrowheads point to the immature CA layer, whereas white arrows point to the NC-RNA layer. Immature, MA-p6 and CA-p6 variants show both CA and NC-RNA layers. In CA-p6 the distance between the CA layer and the membrane is more variable. In MA-SP1 and MA-CA, the CA layer is seen, but the NC-RNA has condensed. CA-SP1 and the mature virus do not show the characteristic striated CA layer. The scale bar is 50 nm.
Figure 3
Figure 3. The global arrangement of the Gag layer.
Global lattice maps for each variant superimposed on central sections of the tomographic reconstruction of the virus (left panels), or viewed from the direction of the largest gap in the lattice (right panels). The centres of each hexameric unit cell are marked with hexamers, which are coloured according to cross correlation on a scale from low (red) to high (green). Higher cross correlation values indicate that the subtomogram is more similar to the average structure. The cross-correlation range in each map has been set between the minimum and the maximum cross-correlation value present in the map. Maps are shown in perspective such that hexamers on the rear surface of the particle appear smaller.
Figure 4
Figure 4. The local structure of the Gag layer.
A) Radial sections from the subtomogram average reconstructions coming from each variant. Density is white. The scale bar is 10 nm. B) Surface rendering of the subtomogram average reconstructions. A sector of 90° has been cut out to better show the organization of the lattice. The colours on the surfaces are for illustrative purposes. The membrane and the MA layer, which cannot be delineated at this resolution, are yellow. N-terminal CA domain is blue. C-terminal CA domain and SP1 spacer are green. NC-RNA layer is grey. In MA-SP1 and MA-CA the grey NC-RNA layer is missing because condensation has already taken place, and rod-like protrusions are seen descending from the C-terminal CA domain towards the centre of the virus particle. Arrowheads mark the radial position of the rod-like densities.
Figure 5
Figure 5. Analysis of disrupted virus particles.
Micrographs of MA – SP1 (A) and MA – CA (B) virus particles after disruption by vortexing in the presence of gold beads show patches of viral membrane with underlying CA lattice. The condensed NC – RNA is visible as an irregular, globular density similar to that seen within intact virus particles (compare with figure 2B). Rather than diffusing away from the broken particles, the NC-RNA appears to remain associated with the CA lattice. The scale bar is 50 nm.

References

    1. Demirov DG, Freed EO. Retrovirus budding. Virus Res. 2004;106:87–102. - PubMed
    1. Morita E, Sundquist WI. Retrovirus budding. Annu Rev Cell Dev Biol. 2004;20:395–425. - PubMed
    1. Ganser-Pornillos BK, Yeager M, Sundquist W. The structural biology of HIV assembly. Curr Opin Struct Biol. 2008;18:203–217. - PMC - PubMed
    1. Coffin JM, Hughes SH, Varmus HE. Retroviruses 1998.
    1. Hurley JH. ESCRT complexes and the biogenesis of multivesicular bodies. Curr Opin Cell Biol. 2008;20:4–11. - PMC - PubMed

Publication types

MeSH terms

Substances