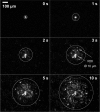
Chemical stimulation of adherent cells by localized application of acetylcholine from a microfluidic system
- PMID: 21151808
- PMCID: PMC2999818
- DOI: 10.3389/fneng.2010.00113
Chemical stimulation of adherent cells by localized application of acetylcholine from a microfluidic system
Abstract
Chemical stimulation of cells is inherently cell type selective in contrast to electro-stimulation. The availability of a system for localized application of minute amounts of chemical stimulants could be useful for dose related response studies to test new compounds. It could also bring forward the development of a novel type of neuroprostheses. In an experimental setup microdroplets of an acetylcholine solution were ejected from a fluidic microsystem and applied to the bottom of a nanoporous membrane. The solution traveled through the pores to the top of the membrane on which TE671 cells were cultivated. Calcium imaging was used to visualize cellular response with temporal and spatial resolution. Experimental demonstration of chemical stimulation for both threshold gated stimulation as well as accumulated dose-response was achieved by either employing acetylcholine as chemical stimulant or applying calcein uptake, respectively. Numerical modeling and simulation of transport mechanisms involved were employed to gain a theoretical understanding of the influence of pore size, concentration of stimulant and droplet volume on the spatial-temporal distribution of stimulant and on the cellular response. Diffusion, pressure driven flow and evaporation effects were taken into account. Fast stimulation kinetic is achieved with pores of 0.82 μm diameter, whereas sustained substance delivery is obtained with nanoporous membranes. In all cases threshold concentrations ranging from 0.01 to 0.015 μM acetylcholine independent of pore size were determined.
Keywords: acetylcholine; calcium imaging; chemical stimulation; microfluidic system; nanoporous membrane; neurotechnology; numeric modeling.
Figures


Similar articles
-
Localized functional chemical stimulation of TE 671 cells cultured on nanoporous membrane by calcein and acetylcholine.Biophys J. 2007 Jan 1;92(1):L04-6. doi: 10.1529/biophysj.106.096743. Epub 2006 Nov 3. Biophys J. 2007. PMID: 17085498 Free PMC article.
-
Size effects of pore density and solute size on water osmosis through nanoporous membrane.J Phys Chem B. 2012 Nov 15;116(45):13459-66. doi: 10.1021/jp3076595. Epub 2012 Nov 6. J Phys Chem B. 2012. PMID: 23116121
-
Rapid spatial and temporal controlled signal delivery over large cell culture areas.Lab Chip. 2011 Sep 21;11(18):3057-63. doi: 10.1039/c1lc20311h. Epub 2011 Aug 1. Lab Chip. 2011. PMID: 21805010
-
Droplet breakup mechanisms in premix membrane emulsification and related microfluidic channels.Adv Colloid Interface Sci. 2021 Apr;290:102393. doi: 10.1016/j.cis.2021.102393. Epub 2021 Mar 2. Adv Colloid Interface Sci. 2021. PMID: 33770649 Review.
-
Miniaturized microfluidic formats for cell-based high-throughput screening.Crit Rev Biomed Eng. 2009;37(3):193-257. doi: 10.1615/critrevbiomedeng.v37.i3.10. Crit Rev Biomed Eng. 2009. PMID: 20402621 Review.
Cited by
-
Microfabricated polymer-metal biosensors for multifarious data collection from electrogenic cellular models.Microsyst Nanoeng. 2023 Mar 1;9:22. doi: 10.1038/s41378-023-00488-1. eCollection 2023. Microsyst Nanoeng. 2023. PMID: 36875634 Free PMC article.
-
Can Nanofluidic Chemical Release Enable Fast, High Resolution Neurotransmitter-Based Neurostimulation?Front Neurosci. 2016 Mar 31;10:138. doi: 10.3389/fnins.2016.00138. eCollection 2016. Front Neurosci. 2016. PMID: 27065794 Free PMC article.
-
Solid-State Nanopores for Spatially Resolved Chemical Neuromodulation.Nano Lett. 2024 Dec 4;24(48):15215-15225. doi: 10.1021/acs.nanolett.4c02604. Epub 2024 Nov 19. Nano Lett. 2024. PMID: 39561980 Free PMC article.
-
Rapid photothermal actuation of light-addressable, arrayed hydrogel columns in a macroporous silicon membrane.Sens Actuators A Phys. 2020 Jan 1;301:111729. doi: 10.1016/j.sna.2019.111729. Epub 2019 Nov 9. Sens Actuators A Phys. 2020. PMID: 32863582 Free PMC article.
References
-
- Bencherif M., Lukas R. J. (1991). Ligand binding and functional characterization of muscarinic acetylcholine receptors on the TE671/RD human cell line. J. Pharmacol. Exp. Ther. 257, 946–953 - PubMed
-
- Birdi K. S., Vu D. T. (1993). Wettability and the evaporation rates of fluids from solid surfaces. J. Adhes. Sci. Technol. 7, 485–49310.1163/156856193X00808 - DOI
-
- Birdi K. S., Vu D. T., Winter A. (1989). A study of the evaporation rates of small water drops placed on a solid surface. J. Phys. Chem. 93, 3702–370310.1021/j100346a065 - DOI
-
- Bohl W., Elmendorf W. (2008). Technische Strömungslehre: Stoffeigenschaften von Flüssigkeiten und Gasen, Hydrostatik, Aerostatik, Inkompressible Strömungen, Kompressible Strömungen, Strömungsmesstechnik: Vogel.
LinkOut - more resources
Full Text Sources

