. 2010 Dec 7;8(12):e1000557.
doi: 10.1371/journal.pbio.1000557.

Structure of a classical MHC class I molecule that binds "non-classical" ligands

Affiliations

Structure of a classical MHC class I molecule that binds "non-classical" ligands

Chee Seng Hee et al. PLoS Biol. .

Abstract

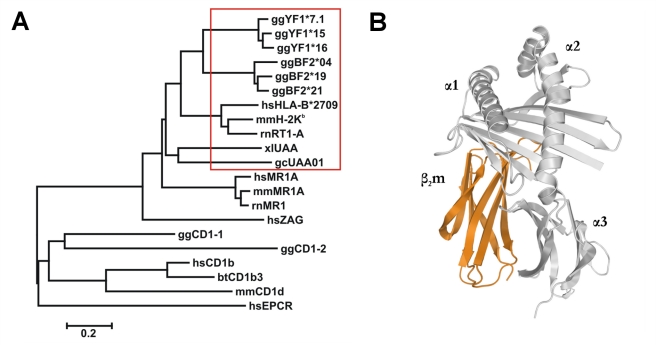
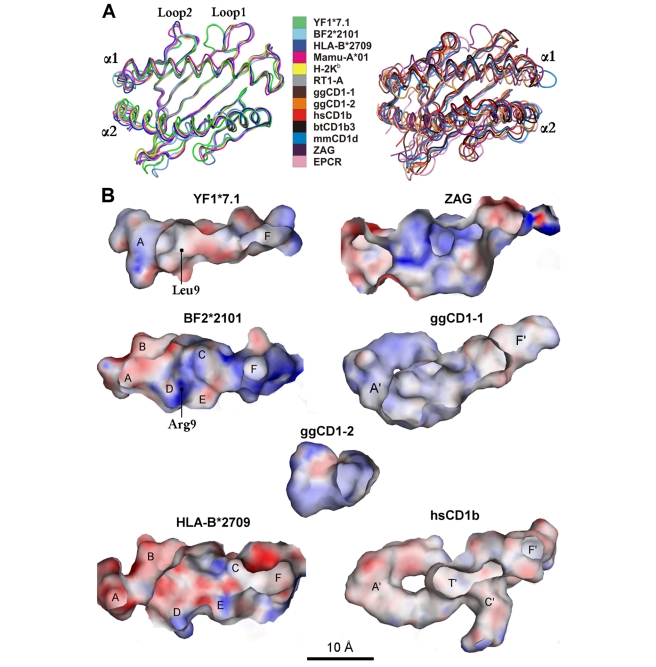
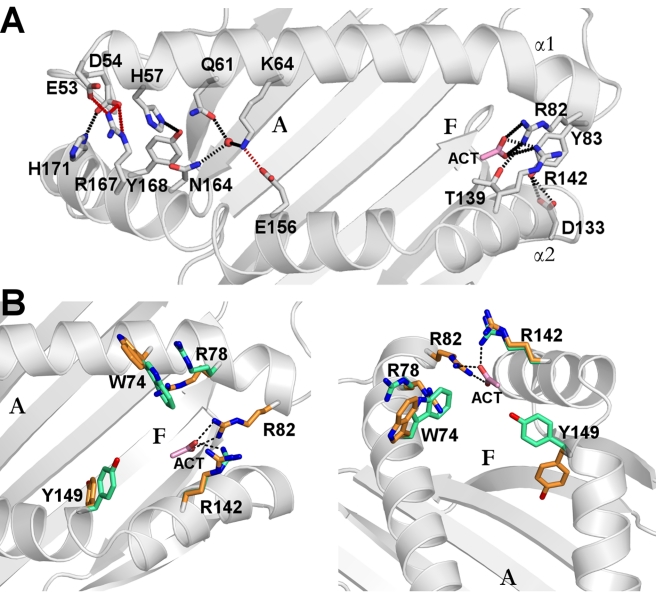
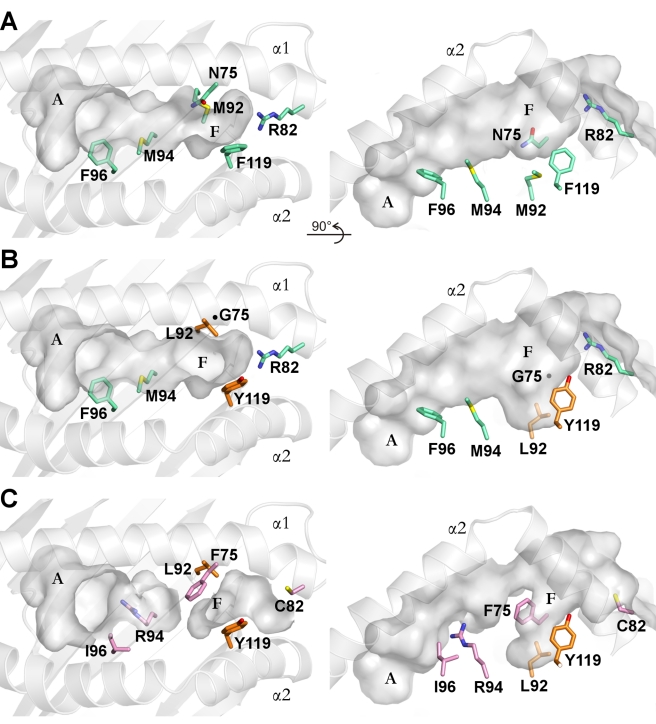
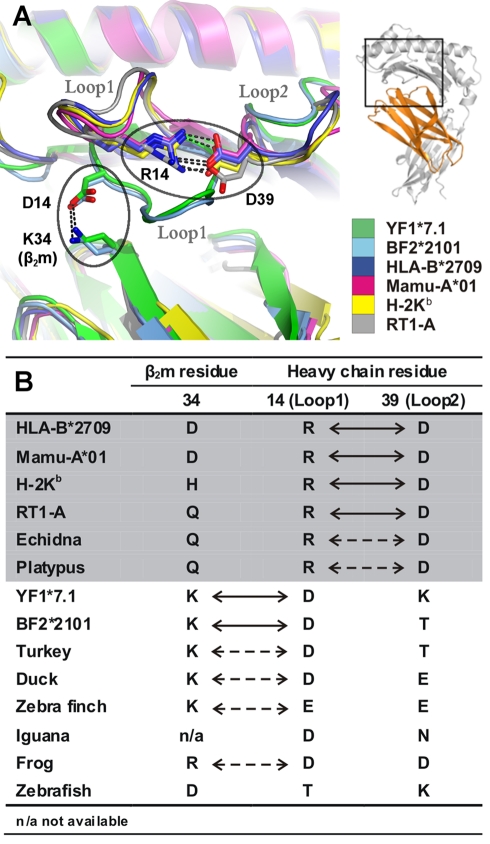
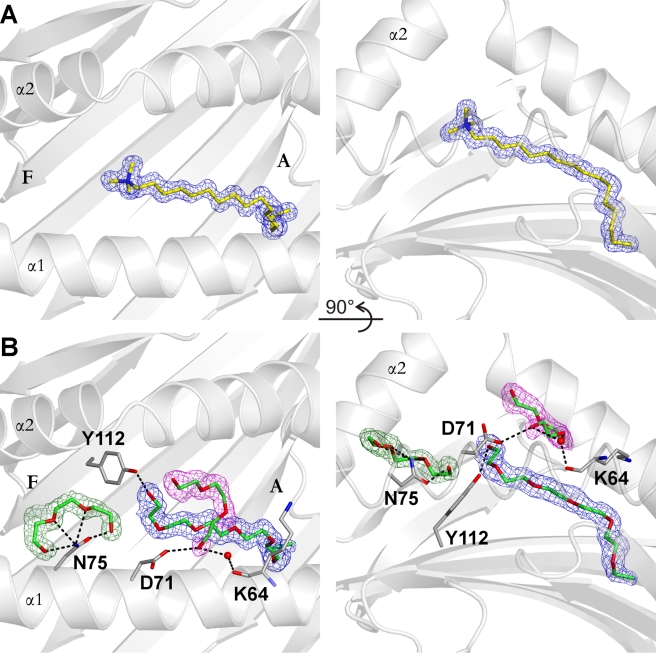
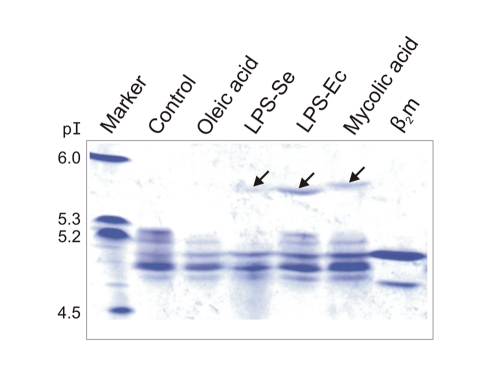
Chicken YF1 genes share a close sequence relationship with classical MHC class I loci but map outside of the core MHC region. To obtain insights into their function, we determined the structure of the YF1*7.1/β(2)-microgloblin complex by X-ray crystallography at 1.3 Å resolution. It exhibits the architecture typical of classical MHC class I molecules but possesses a hydrophobic binding groove that contains a non-peptidic ligand. This finding prompted us to reconstitute YF1*7.1 also with various self-lipids. Seven additional YF1*7.1 structures were solved, but only polyethyleneglycol molecules could be modeled into the electron density within the binding groove. However, an assessment of YF1*7.1 by native isoelectric focusing indicated that the molecules were also able to bind nonself-lipids. The ability of YF1*7.1 to interact with hydrophobic ligands is unprecedented among classical MHC class I proteins and might aid the chicken immune system to recognize a diverse ligand repertoire with a minimal number of MHC class I molecules.


Conflict of interest statement

The authors have declared that no competing interests exist.

Figures

Figure 1
Figure 1. Evolutionary and structural characteristics of YF1*7.1.
(A) The evolutionary tree reveals that YF1 isoforms are closely related to chicken MHC-BF2 variants and classical mammalian as well as non-mammalian (frog, nurse shark) class I heavy chains (red box) but are also similar to mammalian MR1 chains and human ZAG. YF1 heavy chains are, however, only distantly related to chicken and mammalian CD1 molecules as well as to EPCR. The designations of the molecules are given in the Accession Numbers section. The tree is drawn to scale, with branch lengths equivalent to evolutionary distances in the units of the number of amino acid substitutions per site. (B) Ribbon diagram of YF1*7.1 non-covalently associated with β2m (orange), as seen along the binding groove. A ligand has been omitted for clarity.
Figure 2
Figure 2. Binding grooves of YF1*7.1 and selected classical or non-classical class I molecules.
(A) Overlay of α1- and α2-domains, viewed from above. Classical (YF1*7.1, BF2*2101, HLA-B*2709, Mamu-A*01, H-2Kb, RT1-A, left) and non-classical class I molecules (all others, right) (see Materials and Methods for details) are superimposed onto the Cα-backbone of the α1-helix and the β-sheet platform, with selected interstrand loops (Loop1 and Loop2) designated. The Loop1 locations of YF1*7.1 and BF2*2101 are nearly indistinguishable but are distinct from those of classical mammalian MHC class I molecules. An interactive three-dimensional (3D) comparison of these molecules is available in Figure S2. (B) Interior molecular surfaces of ligand-devoid binding grooves. The binding pockets of classical (A–F) and non-classical (A', C', F', T') molecules are indicated. The approximate position of HC residues 9 (Leu in YF1*7.1, Arg in BF2*2101) is indicated (see main text for further explanation). Electrostatic potentials are mapped to the molecular surfaces with positive potential (≥20 mV) in blue, neutral potential (0 mV) in white, and negative potential (≤−40 mV) in red. Although the ZAG groove is predicted to bind hydrophobic ligands , like CD1 molecules, it appears closely related to that of YF1*7.1 (see also Table S1).
Figure 3
Figure 3. Side chain interactions in the vicinity of the YF1*7.1 binding groove.
(A) Side chain interactions between α1- and α2-helices partially cover the A pocket and close the binding groove terminals. Side chains are shown as stick representation with hydrogen bonds and salt bridges indicated by dotted lines. An acetate molecule (ACT) “above” the F pocket is shown as pink stick representation. (B) Two views of the F pocket showing residues that might be involved in ligand binding due to their conformational dynamics. On the left is the view from “above” the binding groove and, on the right, the view from the A pocket along the binding groove towards the F pocket. Residues exhibiting dual conformations are distinguished by orange and green colors. The side chains of Trp74, Arg78, Arg142, and Tyr149 “above” the F pocket have poorly defined electron density compared to the surrounding residues, indicating that they might interact with ligands captured within the F pocket. Also near the F pocket, Arg82 interacts with an acetate molecule, indicating that this HC residue might also be involved in ligand binding.
Figure 4
Figure 4. Polymorphic residues of YF1 alleles within the binding groove.
Polymorphic residues of YF1*15 and YF1*16 are “mutated” in silico using the YF1*7.1 structure as model. Two views are shown for each allele: on the left, views from “above” the binding groove, and on the right, views “through” the α2-helix. The A and F pockets as well as the α1- and α2-helices are labeled accordingly. (A) Six polymorphic residues that influence the binding groove architectures are shown in green stick representation in YF1*7.1. (B) Substitutions of Asn75Gly and Met92Leu (orange stick representation) in YF1*15 result in a wider groove entrance and deeper F pocket, respectively. The Phe119Tyr exchange slightly narrows the F pocket. The position of Gly75 is shown as a black dot. (C) Six substitutions in YF1*16 result in a division of the binding groove into two parts. The Phe96Ile exchange in YF1*16 slightly enlarges the A pocket, while the substitutions Asn75Phe and Met94Arg are expected to disrupt the middle part of the binding groove. The Asn75Phe exchange also narrows the F pocket together with the Phe119Tyr substitution. The Arg82Cys substitution leaves the F terminal part of the binding groove open, and the Met92Leu substitution results in a deeper F pocket similar to that observed in the case of YF1*15.
Figure 5
Figure 5. Distinct loop interactions in classical mammalian and chicken MHC class I molecules.
(A) Overlay of chicken YF1*7.1 and selected class I molecules reveal that the Loop1 conformations in the YF1*7.1 and BF2*2101 molecules of the chicken deviate from those of mammalian classical class I antigens. This is due to different contacts made by residue 14 of the HC: Asp14 of YF1*7.1 and BF2*2101 interact with Lys34 of β2m, whereas Arg14 of HLA-B*2709, Mamu-A*01 (rhesus macaque), H-2Kb, and RT1-A contact Asp39 of Loop2 (regions of interest indicated by ellipses). Salt bridges are indicated by black dotted lines. The location of the enlarged area within YF1*7.1 is shown on the right, together with a color legend. Carboxyl group atoms of Asp residues and nitrogen side chain atoms of Lys and Arg are colored in red and blue, respectively. (B) Summary of residues involved in the Loop1 - β2m or Loop1-Loop2 interactions in various species. Contacts supported by molecular structures are indicated by arrows, and suggested interactions are shown by dotted arrows. The area shaded in grey indicates placental (human, rhesus macaque, mouse, rat) and egg-laying mammals (echidna, platypus).
Figure 6
Figure 6. Electron densities observed in YF1*7.1 structures.
The electron densities derived from 2Fo–Fc maps after refinement are shown as blue, magenta, and green meshes with a contour level of 1σ. Two different types of electron densities (resembling those depicted in A or B) can be observed in eight data sets collected under different cryo-conditions. Side chains interacting with ligands are shown as grey stick representation, with oxygen and nitrogen atoms indicated with red and blue color, respectively. Hydrogen bonds are shown as black dashed lines. Two views are displayed for each type of electron density: on the left, views from “above” the binding groove, and on the right, views from the α1-helix (visible as loop in the foreground). (A) Electron density of the YF1*7.1 complex without an added ligand cryo-protected with glycerol (YF1*7.1:L1). (B) Electron density of the YF1*7.1:L2 complex, using PEG 200 for cryoprotection. Three α1-helical residues are involved in indirect (Lys64) or direct (Asp71, Asn75) contacts to the PEG 200 molecules.
Figure 7
Figure 7. Isoelectric focusing analysis of YF1*7.1 complexes incubated with lipid preparations.
The pI of marker protein (lane left) is indicated. The analysis comprised (I) YF1*7.1 without added lipid, (II) YF1*7.1 with oleic acid, (III) YF1*7.1 with lipopolysaccharide from S. enterica, (IV) YF1*7.1 with lipopolysaccharide from E. coli, (V) YF1*7.1 with mycolic acid, and (VI) monomeric β2m. The arrows indicate the positions of novel bands obtained following incubation of YF1*7.1 complexes with selected lipid preparations.

References

    1. Pink J. R. L, Koch C, Ziegler A. Immuno-ornithological conversation. In: Steinberg C. M, Lefkovits I, editors. Festschrift in honor of Niels Kaj Jerne on the occasion of his 70th birthday: the immune system. Basel: Karger; 1981. pp. 69–75.
    1. Kelley J, Walter L, Trowsdale J. Comparative genomics of major histocompatibility complexes. Immunogenetics. 2005;56:683–695. - PubMed
    1. Madden D. R. The 3-dimensional structure of peptide-MHC complexes. Ann Rev Immunol. 1995;13:587–622. - PubMed
    1. Silk J. D, Salio M, Brown J, Jones E. Y, Cerundolo V. Structural and functional aspects of lipid binding by CD1 molecules. Ann Rev Cell Dev Biol. 2008;24:369–395. - PubMed
    1. Bennett M. J, Lebron J. A, Bjorkman P. J. Crystal structure of the hereditary haemochromatosis protein HFE complexed with transferrin receptor. Nature. 2000;403:46–53. - PubMed

Publication types

MeSH terms

Substances