

A broad assessment of factors determining Culicoides imicola abundance: modelling the present and forecasting its future in climate change scenarios
- PMID: 21151914
- PMCID: PMC2997795
- DOI: 10.1371/journal.pone.0014236
A broad assessment of factors determining Culicoides imicola abundance: modelling the present and forecasting its future in climate change scenarios
Abstract
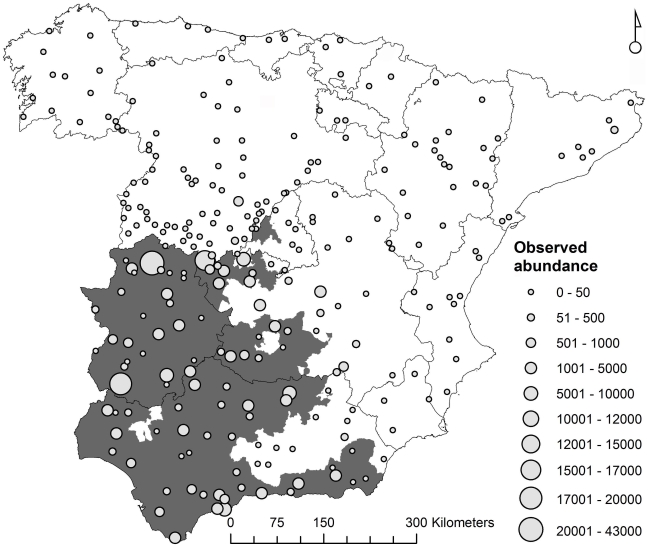
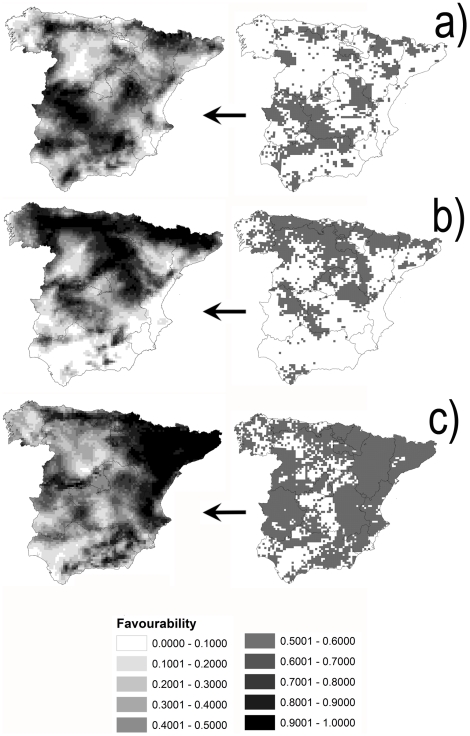
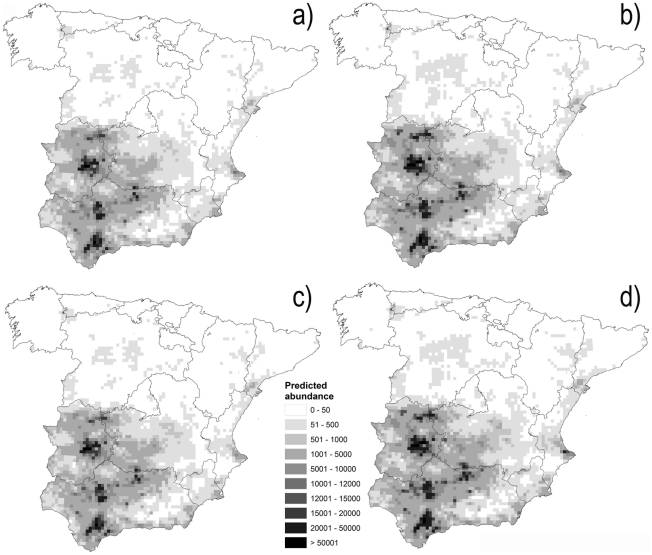
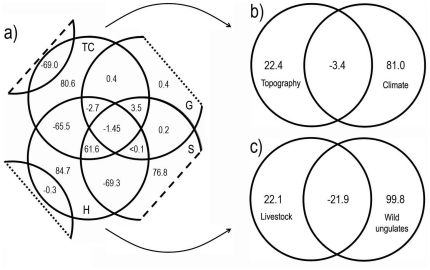
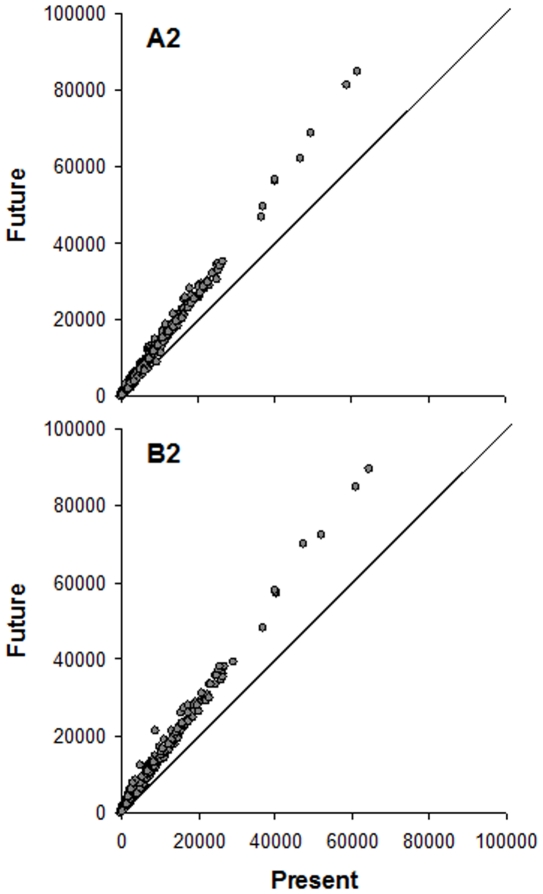
Bluetongue (BT) is still present in Europe and the introduction of new serotypes from endemic areas in the African continent is a possible threat. Culicoides imicola remains one of the most relevant BT vectors in Spain and research on the environmental determinants driving its life cycle is key to preventing and controlling BT. Our aim was to improve our understanding of the biotic and abiotic determinants of C. imicola by modelling its present abundance, studying the spatial pattern of predicted abundance in relation to BT outbreaks, and investigating how the predicted current distribution and abundance patterns might change under future (2011-2040) scenarios of climate change according to the Intergovernmental Panel on Climate Change. C. imicola abundance data from the bluetongue national surveillance programme were modelled with spatial, topoclimatic, host and soil factors. The influence of these factors was further assessed by variation partitioning procedures. The predicted abundance of C. imicola was also projected to a future period. Variation partitioning demonstrated that the pure effect of host and topoclimate factors explained a high percentage (>80%) of the variation. The pure effect of soil followed in importance in explaining the abundance of C. imicola. A close link was confirmed between C. imicola abundance and BT outbreaks. To the best of our knowledge, this study is the first to consider wild and domestic hosts in predictive modelling for an arthropod vector. The main findings regarding the near future show that there is no evidence to suggest that there will be an important increase in the distribution range of C. imicola; this contrasts with an expected increase in abundance in the areas where it is already present in mainland Spain. What may be expected regarding the future scenario for orbiviruses in mainland Spain, is that higher predicted C. imicola abundance may significantly change the rate of transmission of orbiviruses.
Conflict of interest statement
Figures
References
-
- Soberón J. Niche and area of distribution modeling: a population ecology perspective. Ecography. 2010;33:159–167.
-
- Guisan A, Zimmermann NE. Predictive habitat distribution models in ecology. Ecol Model. 2000;135:147–186.
-
- Hudson PJ, Rizzoli A, Grenfell BT, Heesterbeek H, Dobson AP. Oxford: Oxford University Press; 2002. The ecology of wildlife diseases.218
-
- Scheiner SM. The intersection of the sciences of biogeography and infectious diseases ecology. EcoHealth. 2010;6:483–488. - PubMed
Publication types
MeSH terms
LinkOut - more resources
Full Text Sources
