. 2010 Dec 3;5(12):e15068.
doi: 10.1371/journal.pone.0015068.

Analysis of kinase gene expression patterns across 5681 human tissue samples reveals functional genomic taxonomy of the kinome

Affiliations

Analysis of kinase gene expression patterns across 5681 human tissue samples reveals functional genomic taxonomy of the kinome

Sami Kilpinen et al. PLoS One. .

Abstract

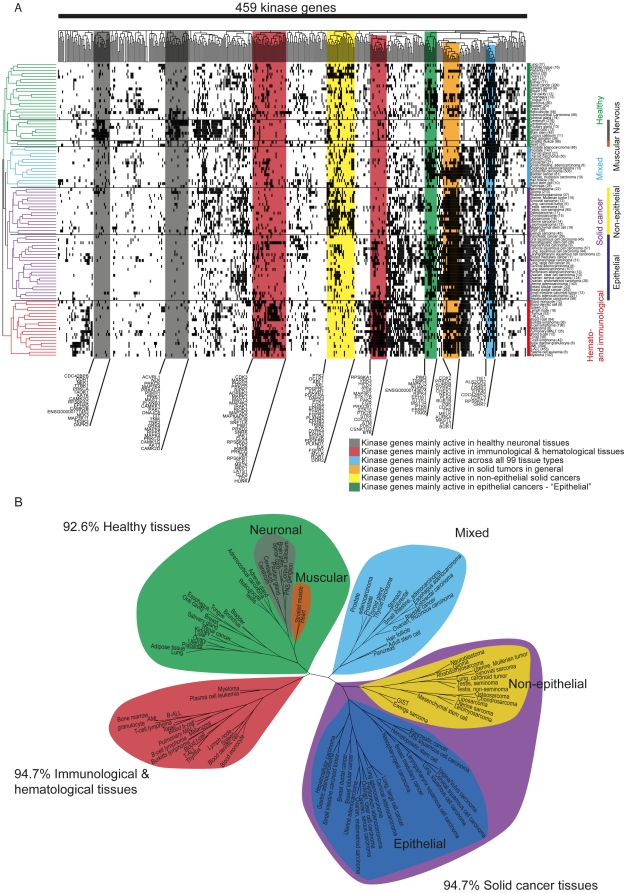
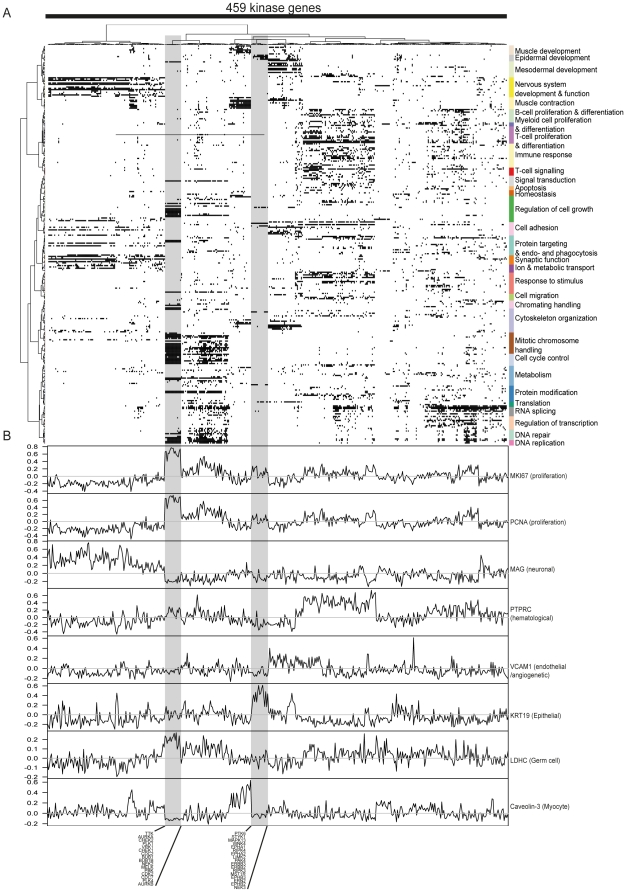
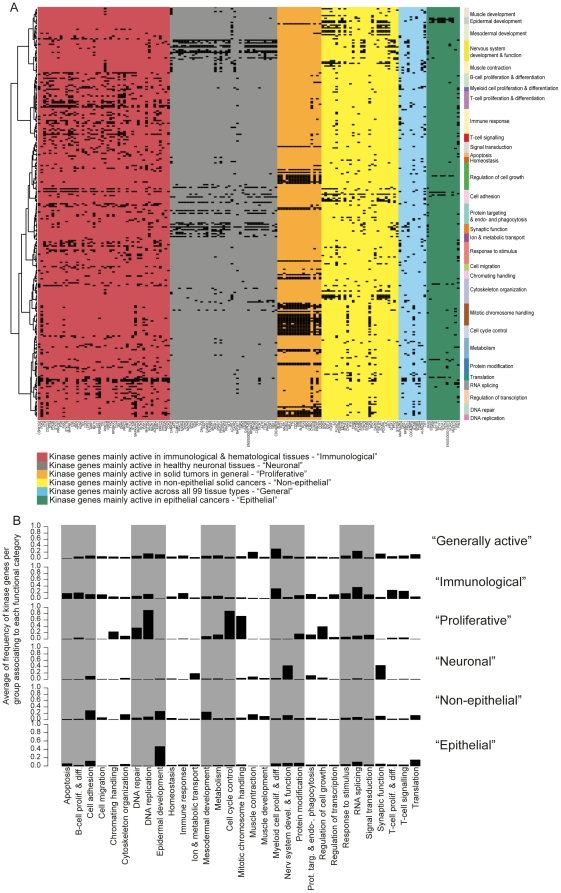
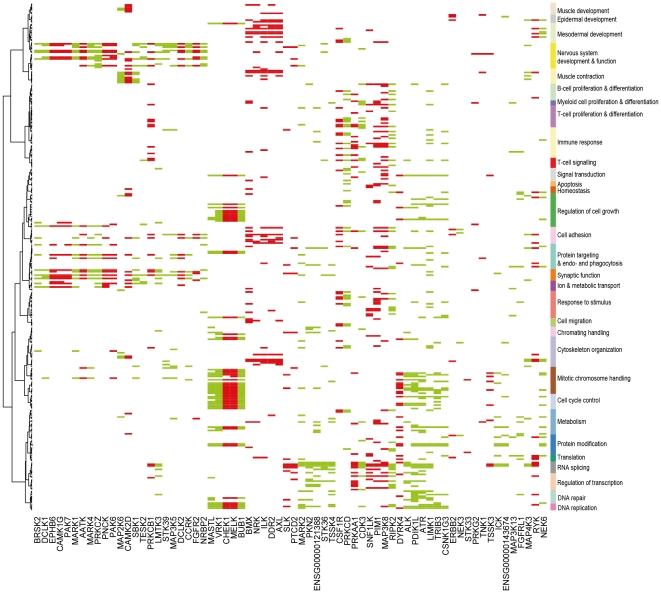
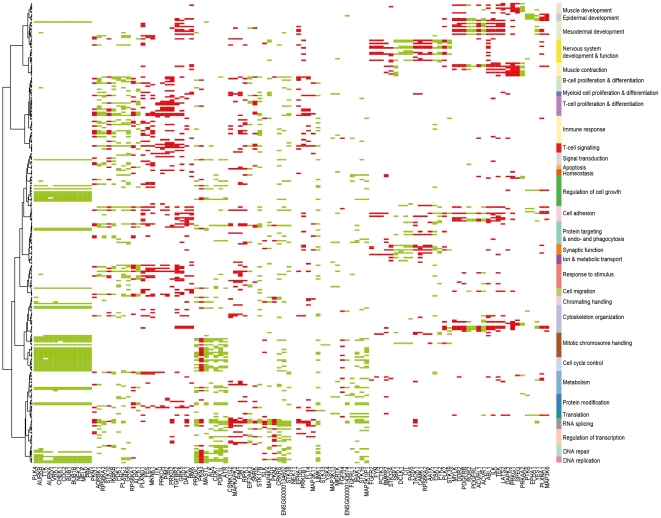
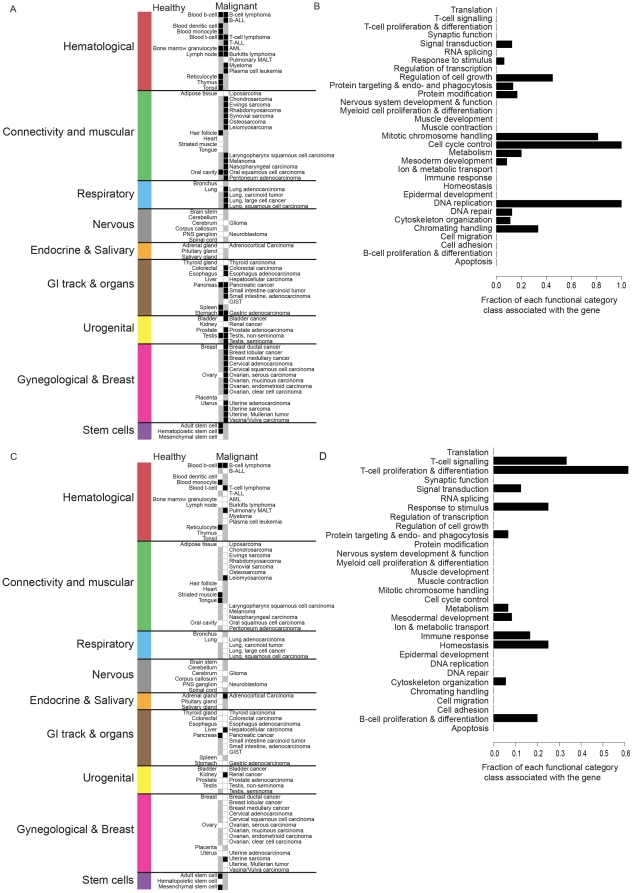
Kinases play key roles in cell signaling and represent major targets for drug development, but the regulation of their activation and their associations with health and disease have not been systematically analyzed. Here, we carried out a bioinformatic analysis of the expression levels of 459 human kinase genes in 5681 samples consisting of 44 healthy and 55 malignant human tissues. Defining the tissues where the kinase genes were transcriptionally active led to a functional genomic taxonomy of the kinome and a classification of human tissues and disease types based on the similarity of their kinome gene expression. The co-expression network around each of the kinase genes was defined in order to determine the functional context, i.e. the biological processes that were active in the cells and tissues where the kinase gene was expressed. Strong associations for individual kinases were found for mitosis (69 genes, including AURKA and BUB1), cell cycle control (73 genes, including PLK1 and AURKB), DNA repair (49 genes, including CHEK1 and ATR), immune response (72 genes, including MATK), neuronal (131 genes, including PRKCE) and muscular (72 genes, including MYLK2) functions. We then analyzed which kinase genes gain or lose transcriptional activity in the development of prostate and lung cancers and elucidated the functional associations of individual cancer associated kinase genes. In summary, we report here a systematic classification of kinases based on the bioinformatic analysis of their expression in human tissues and diseases, as well as grouping of tissues and tumor types according to the similarity of their kinome transcription.


Conflict of interest statement

Competing Interests: SK and OK are shareholders in MediSapiens Ltd. SK is inventor in patent application PCT/FI2009/050264. This does not alter the authors' adherence to all the PLoS ONE policies on sharing data and materials.

Figures

Figure 1
Figure 1. A) Kinase transcriptional activity over 44 healthy and 55 malignant tissues.
The number of samples per tissue is given in parentheses. The x-axis contains 459 kinase genes. Black indicates transcriptional activity of the kinase in the tissue. The figure has been clustered in both dimensions (binary distance measure with complete linkage). Several tissue groups can be identified (marked as color bars on the right side of the image). Correspondingly several groups of kinases can be identified having a distinctly different activity profile in tissue groups (colored vertical bars, with kinase gene names of the identified groups shown below). B) Tree of tissues as defined their by transcriptionally active kinome (same as on the left side of image in panel A). The four main groups of tissues are mainly solid healthy tissues (92.6%), immunological & hematological (94.7%), solid cancer tissues (94.7%) and a mixed one. Within these groups there are some more specific clusters like neuronal and muscular on the healthy side and non-epithelial and epithelial on the cancer side. Epithelial cancers also show visible tendency to cluster to adeno and squamous groups according to their transcriptionally active kinome.
Figure 2
Figure 2. A) Functional associations of human kinase-encoding genes.
The x-axis contains 459 kinase genes and the y-axis contains GO-BP classes. For the sake of clarity only those biological processes (GO-BP) enriched in the co-expression environment of at least 15 kinases are shown (301). Detailed information of all GO-BP class associations of the kinase genes are given in the Supplementary tables. The x-axis has been clustered with binary distance measure with complete linkage. The y-axis has been clustered in terms of semantic similarity of the GO-BP classes. The predominant biological interpretations of each cluster are given on the right side of the image. The analysis of the co-expression space made it possible to elucidate in what kind of biological processes kinase genes are expressed. B) Pearson correlation coefficients of functional and tissue specific marker genes with the expression levels of each kinase gene. Below the figure are listed the gene names in two groups kinase genes. The group on the left is associated with cell cycle and mitotic chromosome handling and has elevated correlation to MKI67 and PCNA. The group on the right is associated to epidermal development and has elevated correlation to KRT19.
Figure 3
Figure 3. Functional context associations of example kinase gene groups ( Figure 1 ).
A) The y-axis contains GO-biological processes in the same order as in Figure 2. “Immunological” kinase genes (marked with red) associate mainly to B-cell, T-cell and myeloid cell proliferation & differentiation as well as to immune response. “Neuronal” kinase genes (marked with grey) associate strongly to neuronal functions. “Proliferation” kinase genes (marked with orange) associate very strongly to cell cycle control, mitotic chromosome handling, DNA replication, DNA repair and regulation of cell growth. “Non-epithelial” kinase genes (marked with yellow) associate most to cell adhesion, cytoskelton organization, epidermal development and mesodermal development. Functional associations of kinase genes active in most of 99 analyzed tissues (“General”, marked with blue) seems to cover almost all processes present in the analysis with marginally more in RNA splicing, muscle contraction and myeloid cell proliferation & differentiation. As assumed, “Epithelial” kinase genes associate strongly to epidermal development. B) The average frequency of kinase genes per group associating to each functional category.
Figure 4
Figure 4. Gain and loss of transcriptional activity between healthy prostate and prostate cancer.
On the x-axis (clustered with binary distance and Ward linkage) are 68 kinases whose transcriptional activity is either gained (green color) or lost (red color) in prostate cancer when compared to healthy prostate. On the y-axis are functional context associations of the kinases in the same semantically defined order as in Figure 2. This analysis allows identification of kinases whose transcription is elevated to active level or kinases whose biologically active level is most likely lost as well as the functional context to which the kinases are associated. Some notable changes in the kinome transcriptome include the losses of transcriptional activity of BMX, NRK, ILK, DDR2, AXL and RYK which all associate to processes like cytoskeleton organization, cell adhesion, meso- and epidermal development. Similarly, there is a group of kinases with gained transcriptional activity (MASTL, VRK1, BUB1, ALK, PDIK1L, ATR, LIMK1, TRIB3, CSNK1G3) associating to cell cycle control, mitotic chromosome handling, DNA replication and regulation of cell growth.
Figure 5
Figure 5. Gain and loss of transcriptional activity between healthy lung and lung adenocarcinoma.
On the x-axis (clustered with binary distance and Ward linkage) are 106 kinases whose transcriptional activity is either gained (green color) or lost (red color) in lung adenocarcinoma when compared to healthy lung. On the y-axis are functional context associations of the kinases in the same semantically defined order as in the figure 2. This analysis allows identification of kinases whose transcription is elevated to active level or kinases whose biologically active level is most likely lost as well as the functional context to which the kinase genes are associated. Some notable changes in the kinome transcription include a major gain of kinases associating to DNA replication, cell cycle control, mitotic chromosome handling and regulation of cell growth.
Figure 6
Figure 6. Transcriptional activity level across 44 healthy and 55 malignant tissues and functional context associations of individual kinases.
A) Transcriptional activity levels of VRK1. Vertical ordering of tissues is based on the anatomical system from which the tissue originates (colored bar on the left). The left column shows transcriptional activity levels across 44 healthy tissues (white  =  transcriptionally non-active, black  =  transcriptionally active). The right side shows transcriptional activity levels across 55 malignant tissues. B) Functional context associations of the VRK1. Barplot shows the fraction of GO-BP classes of each functional category being associated to the gene through its co-expression environment. According to the analysis VRK1 seems to be in generally transcriptionally active in both healthy and malignant hematological tissues. It is also active in almost all tumors of connectivity and muscular system (sarcomas, head and neck and melanoma). The most prominent difference between healthy and malignant tissues is in female specific tissues as the gene is transcriptionally active in all histological subtypes of breast, cervical, ovarian and uterine cancers, but not in any of the corresponding healthy tissues. VRK1 has strong functional context associations to cell cycle control, mitotic chromosome handling and chromatin handling. C) C21orf7 is transciptionally active in immunological tissues, especially in several lymphomas. It is also active in mesenchymal and adult stem cells. Additionally, there is a possible ectopic expression of this otherwise lymphoid and stem cell specific gene in few distinct carcinomas. D) The functional context associations lands gene firmly to the B- and T-cell signaling and differentiation as well as to immuno response, response to stimulus and homeostasis related processes.

References

    1. Johnson SA, Hunter T. Kinomics: methods for deciphering the kinome. Nat Methods. 2005;2:17–25. - PubMed
    1. de Carcer G, de Castro IP, Malumbres M. Targeting cell cycle kinases for cancer therapy. Curr Med Chem. 2007;14:969–985. - PubMed
    1. Serova M, Ghoul A, Benhadji KA, Cvitkovic E, Faivre S, et al. Preclinical and clinical development of novel agents that target the protein kinase C family. Semin Oncol. 2006;33:466–478. - PubMed
    1. Swanton C, Marani M, Pardo O, Warne PH, Kelly G, et al. Regulators of mitotic arrest and ceramide metabolism are determinants of sensitivity to paclitaxel and other chemotherapeutic drugs. Cancer Cell. 2007;11:498–512. - PubMed
    1. Wood KW, Cornwell WD, Jackson JR. Past and future of the mitotic spindle as an oncology target. Curr Opin Pharmacol. 2001;1:370–377. - PubMed

Publication types

Substances