. 2010 Dec 2;6(12):e1001229.
doi: 10.1371/journal.pgen.1001229.

The loss of PGAM5 suppresses the mitochondrial degeneration caused by inactivation of PINK1 in Drosophila

Affiliations

The loss of PGAM5 suppresses the mitochondrial degeneration caused by inactivation of PINK1 in Drosophila

Yuzuru Imai et al. PLoS Genet. .

Abstract

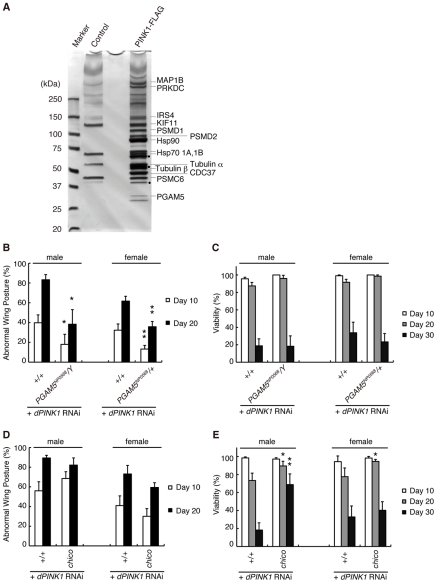
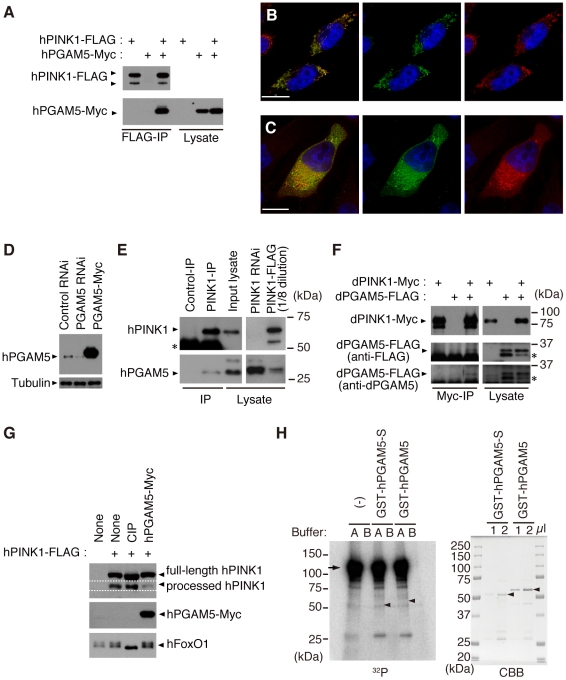
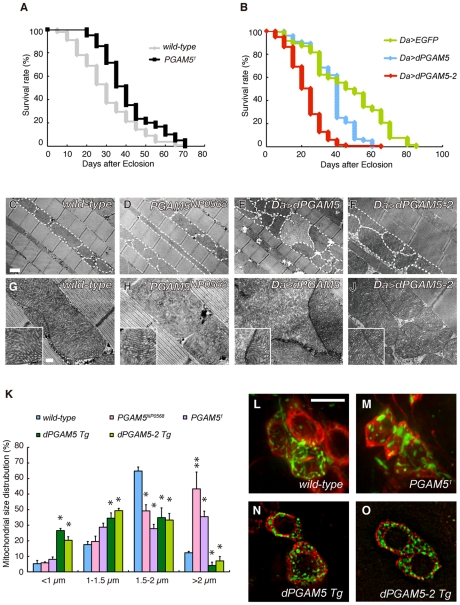
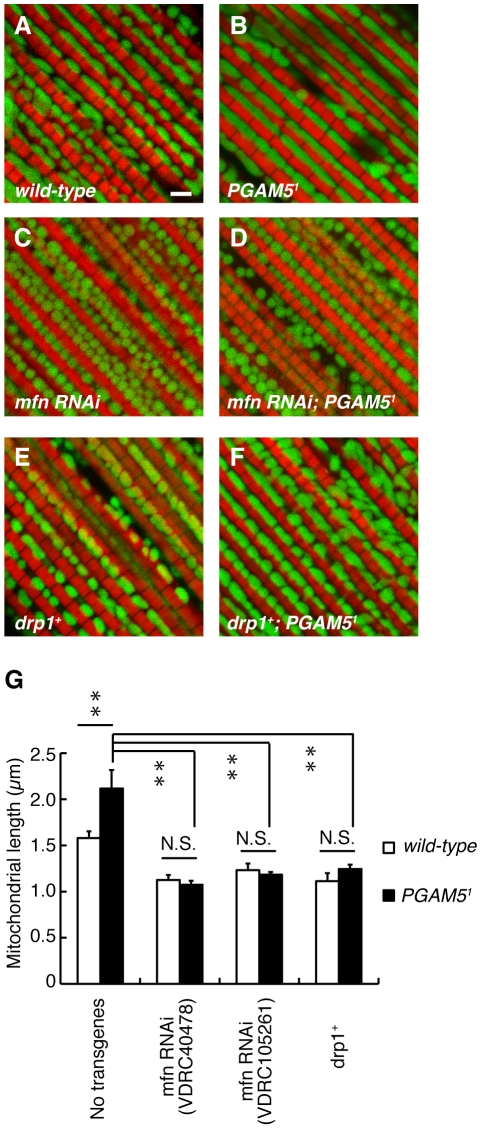
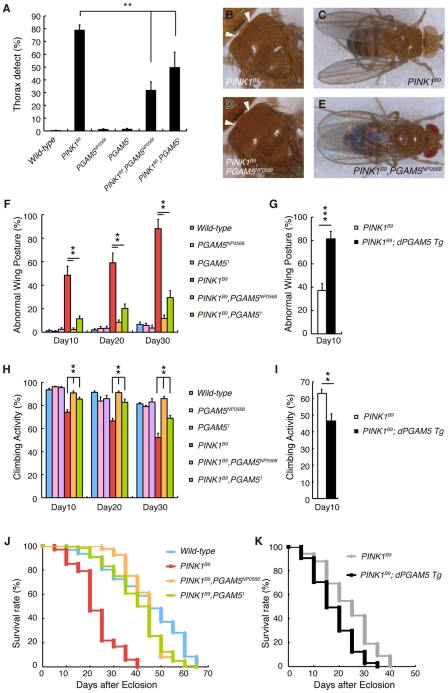
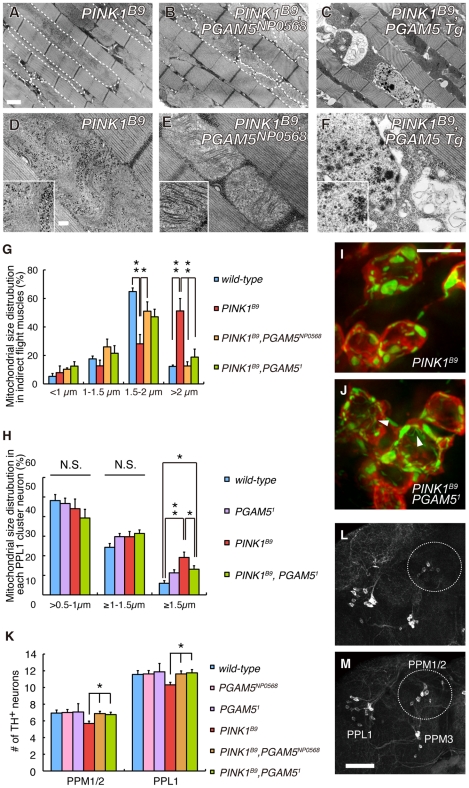
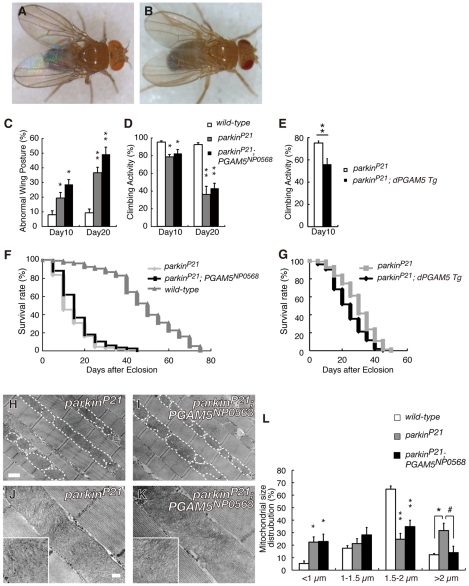
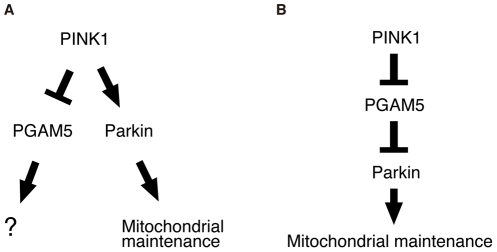
PTEN-induced kinase 1 (PINK1), which is required for mitochondrial homeostasis, is a gene product responsible for early-onset Parkinson's disease (PD). Another early onset PD gene product, Parkin, has been suggested to function downstream of the PINK1 signalling pathway based on genetic studies in Drosophila. PINK1 is a serine/threonine kinase with a predicted mitochondrial target sequence and a probable transmembrane domain at the N-terminus, while Parkin is a RING-finger protein with ubiquitin-ligase (E3) activity. However, how PINK1 and Parkin regulate mitochondrial activity is largely unknown. To explore the molecular mechanism underlying the interaction between PINK1 and Parkin, we biochemically purified PINK1-binding proteins from human cultured cells and screened the genes encoding these binding proteins using Drosophila PINK1 (dPINK1) models to isolate a molecule(s) involved in the PINK1 pathology. Here we report that a PINK1-binding mitochondrial protein, PGAM5, modulates the PINK1 pathway. Loss of Drosophila PGAM5 (dPGAM5) can suppress the muscle degeneration, motor defects, and shorter lifespan that result from dPINK1 inactivation and that can be attributed to mitochondrial degeneration. However, dPGAM5 inactivation fails to modulate the phenotypes of parkin mutant flies. Conversely, ectopic expression of dPGAM5 exacerbated the dPINK1 and Drosophila parkin (dParkin) phenotypes. These results suggest that PGAM5 negatively regulates the PINK1 pathway related to maintenance of the mitochondria and, furthermore, that PGAM5 acts between PINK1 and Parkin, or functions independently of Parkin downstream of PINK1.


Conflict of interest statement

The authors have declared that no competing interests exist.

Figures

Figure 1
Figure 1. Identification of PINK1-binding proteins that modulate the phenotypes of dPINK1 knockdown fly.
(A) Silver-stained polyacrylamide gel to visualize hPINK1-binding proteins. FLAG elution fractions purified from cells stably expressing hPINK1-FLAG (PINK1-FLAG lane) and parental cells (Control lane) are separated on a gel (For details of the procedure, see Materials and Methods). Bands corresponding to hPINK1 (dots) and representative co-purified proteins are indicated. (B, C) The wing phenotype typical of 10- and 20-day-old dPINK1 RNAi flies (B) was suppressed by the PGAM5NP0568 mutant allele, whereas viability of 10-, 20- and 30-day-old adult flies was not improved (C). *, p<0.05; **, p<0.01 vs. age-matched dPINK1 RNAi group in Student's t-test. The genotypes are as follows: MHC-GAL4> dPINK1RNAi (+/+), PGAM5NP0568/Y; MHC-GAL4> dPINK1RNAi (PGAM5NP0568/Y), PGAM5NP0568/+; MHC-GAL4> dPINK1RNAi (PGAM5NP0568/+). MHC-GAL4, a muscle-specific driver. Flies were raised at 29°C as the RNAi-induced dPINK1 defects are more pronounced when flies are raised at that temperature. (D, E) Removal of one copy of the IRS4 ortholog chico had no effect on the wing phenotype of dPINK1 RNAi flies (D) but improved viability (E). *, p<0.05; **, p<0.01 vs. age-matched dPINK1 RNAi group. The genotypes are: MHC-GAL4> dPINK1RNAi (+/+), chico/+; MHC-GAL4> dPINK1RNAi (chico). Flies were raised at 29°C.
Figure 2
Figure 2. PGAM5 associates with PINK1 at mitochondria.
(A) hPGAM5 binds to hPINK1 in HEK293 cells. Lysate expressing C-terminally Myc-tagged hPGAM5 (hPGAM5-Myc) and FLAG-tagged hPINK1 (hPINK1-FLAG) was subjected to immunoprecipitation with anti-FLAG antibody (FLAG-IP), and analyzed by immunoblotting with anti-tag antibodies. (B) hPGAM5 is localized to the mitochondria. HeLa cells transfected with hPGAM5-Myc were visualized with anti-Myc (green). Mitochondria were visualized with MitoTracker (red) and nuclei with DAPI (blue). Regions of co-localization of hPGAM5 with mitochondria appear in yellow in the merged image. (C) hPGAM5 and hPINK1 co-localize at mitochondria. HeLa cells co-transfected with hPINK1 and hPGAM5-Myc were stained with anti-PINK1 (green) and anti-Myc (red). (D) Anti-hPGAM5 antibody specifically recognizes ∼30 kDa bands in extract from HEK293 cells, which were reduced in lysates from cells treated with siRNAs directed against hPGAM5. Lysate expressing hPGAM5-Myc and anti-tubulin signals served as a positive control and a loading control, respectively. (E) Endogenous hPGAM5 is associated with hPINK1. An anti-PINK1 (PINK1-IP) or an antibody against the unrelated protein Delta (Control-IP) was used for immunoprecipitation of proteins in HEK293 cells. Cell lysate in which hPINK1 was knocked down by RNAi (PINK1 RNAi) and lysate from cells that overexpressed hPINK1-FLAG (PINK1-FLAG) served as additional controls. The PINK1-FLAG lysate was diluted eight-fold with loading buffer to reduce the strong signal present in that sample. Asterisk, bands attributable to detection of the antibodies themselves, which may mask lower molecular weight hPINK1 bands (∼52 kDa). (F) dPGAM5 is associated with dPINK1 in Drosophila S2 cells. S2 cell lysate expressing dPINK1-Myc and dPGAM5-FLAG was subjected to immunoprecipitation with anti-Myc antibody (Myc-IP), and analyzed by immunoblotting with anti-tag or anti-dPGAM5 antibodies. Asterisks, a putative processed form of dPGAM5. (G) HEK 293 cell lysate expressing hPINK1-FLAG together with hPGAM5-Myc was subjected to Phos-tag immunoblotting . hPINK1-FLAG lysate treated with alkaline phosphatase (CIP) was used as a positive control. A phospho-protein FoxO1 was efficiently dephosphorylated by the CIP treatment. (H) An in vitro kinase assay was performed using 2x GST-dPINK1 and GST-hPGAM5. Recombinant 2x GST-dPINK1 purified from bacteria was used as a kinase source. Recombinant GST-hPGAM5 short form (GST-hPGAM5-S) or GST-hPGAM5 was purified from bacteria and 1 and 2 µl of the purified fractions were separated by SDS-PAGE and stained with Coomassie Brilliant Blue (CBB, right-hand panel; arrowheads, GST-hPGAM5-S or GST-hPGAM5). A total of 100 or 400 ng of GST-hPGAM5-S or GST-hPGAM5, respectively, were incubated with 100 ng of 2x GST-dPINK1 in kinase reaction buffer A (100 mM Tris-HCl [pH 7.5], 240 mM NaCl, 30 µM ATP, 10 mM MgCl2, 2 mM CaCl2, 5 µCi γ-32P ATP) or buffer B (100 mM Tris-HCl [pH7.5], 240 mM NaCl, 30 µM ATP, 10 mM EDTA, 5 µCi γ-32P ATP) for 30 min at 30°C. The reaction mixture was suspended in SDS sample buffer and then subjected to SDS-PAGE and autoradiography (Left, 32P; the arrow and arrowheads represent expected migration positions of 2x GST-dPINK1 and GST-hPGAM5/GST-hPGAM5-S, respectively). No specific signals corresponding hPGAM5 or hPGAM5-S were observed. Note that 2x GST-dPINK1 lacks kinase activity in the buffer B, suggesting that activation of PINK1 requires divalent cations such as Mg2+ and Ca2+. Scale bars  = 15 µm in (B and C).
Figure 3
Figure 3. dPGAM5 is dispensable for normal development, but affects lifespan in Drosophila.
(A) Loss of dPGAM5 genes extends the lifespan. Adult male wild-type (yw/Y; n = 125) vs. dPGAM5 null (y, PGAM51/Y; n = 125) flies, p<0.001 by log rank test. (B) Overexpression of dPGAM5 or dPGAM5-2 in Drosophila causes shorter lifespan. Overexpression of the transgenes was induced using the ubiquitous daughterless (Da)-GAL4 driver. Lifespan of adult male EGFP (n = 130), dPGAM5 (n = 76) and dPGAM5-2 (n = 117) flies. EGFP vs. dPGAM5, p<0.001; EGFP vs. dPGAM5-2, p<0.001; by log rank test. (C–J) Transmission electron microscopy (TEM) analysis of the indirect flight muscle and morphology of mitochondria in 2-day-old adult flies with the indicated genotypes. In C–F, we outlined some mitochondria with broken lines to highlight morphology. The insets in G–J show representative mitochondria matrixes. A revertant, PINK1RV, was used as a wild-type comparison . The genotypes are: PINK1RV/Y (C, G), PGAM5NP0568/Y (D, H), Da-GAL4> UAS-dPGAM5 (E, I), Da-GAL4> UAS-dPGAM5-2 (F, J). Scale bars  = 1 µm in C–F and 200 nm in G–J. (K) Quantification of the percentage of mitochondrial size distribution in the indirect muscle tissue from wild-type (n = 136 from 5 adult flies), PGAM5NP0568 (n = 155 from 5), PGAM51 (n = 87 from 5), dPGAM5 Tg (n = 143 from 5) and dPGAM5-2 Tg flies (n = 147 from 5) as shown in (C–J). The length of the mitochondria in the direction of the myofibrils was measured. Data are shown as means ± SE (* p<0.05, **p<0.01 vs. wild-type). (L–O) Brain tissues of 5-day-old adult flies were stained with anti-TH antibody (red). Mitochondria labeled with mitoGFP (green) were observed in the PPL1 TH-positive neurons of the indicated genotypes. The genotypes are as follows: TH-GAL4> mitoGFP (wild-type), PGAM51/Y; TH-GAL4>UAS-mitoGFP (PGAM51), UAS-dPGAM5/TH-GAL4> UAS-mitoGFP (dPGAM5 Tg), UAS-dPGAM5-2/TH-GAL4> UAS-mitoGFP (dPGAM5-2 Tg). TH-GAL4, a DA neuron-specific driver. Scale bar  = 5 µm.
Figure 4
Figure 4. Relationship between dPGAM5 and the mitochondrial fusion/fission genes.
(A–F) dPGAM5 inactivation failed to rescue the mitochondrial fragmentation caused by mfn knockdown (mfn RNAi) or introduction of an extra copy of the drp1 gene (drp1+). To visualize the mitochondria under a fluorescence microscopy, we used the muscle-specific MHC-GAL4 driver to induce expression of a mitoGFP (green) transgene in 5-day-old adult flies with the indicated genotypes. Muscle tissue was counterstained with phalloidin (red). Scale bar  = 2 µm. (G) The average length of the mitochondria in the direction of the myofibrils was measured from wild-type (n = 343 from 7 adult flies), PGAM51 (n = 390 from 8), mfn RNAi (VDRC40478, n = 305 from 6; VDRC105261, n = 372 from 8), mfn RNAi (VDRC40478); PGAM51 (n = 355 from 7), mfn RNAi (VDRC105261); PGAM51 (n = 237 from 5), drp1+ (n = 245 from 5) and drp1+; PGAM51 (n = 247 from 5) as shown in (A–F). Data are shown as means ± SE (**p<0.01; N.S., not significant). The genotypes are as follows: +/Y; MHC-GAL4>mitoGFP (A, wild-type), PGAM51/Y; MHC-GAL4>UAS-mitoGFP (B, PGAM51), +/Y; MHC-GAL4>UAS-mitoGFP; UAS-mfn RNAi (VDRC40478) (C, mfn RNAi), PGAM51/Y; MHC-GAL4>UAS-mitoGFP; UAS-mfn RNAi (VDRC40478) (D, mfn RNAi; PGAM51), +/Y; MHC-GAL4>mitoGFP; drp1+ (E, drp1+), PGAM51/Y; MHC-GAL4>mitoGFP; drp1+ (F, drp1+; PGAM51).
Figure 5
Figure 5. Loss of dPGAM5 suppresses dPINK1 mutant phenotypes in Drosophila.
A thorax defect (B, arrowheads) and abnormal wing posture (C) caused by loss of dPINK1 activity are suppressed in dPGAM5 mutant genetic backgrounds (A, D and E). (F) Percentage of 10-, 20- and 30-day-old male flies showing abnormal wing postures. Error bars show S.E. from three experiments. (G) Percentage of 10-day-old male PINK1B9 and PINK1B9 ubiquitously overexpressing dPGAM5 flies showing abnormal wing postures. Error bars show S.E. from three experiments. (H, I) Percentage of locomotor activity. Error bars show S.E. from three repeated experiments. (J) Lifespan of adult male flies. Loss of dPGAM5 partially improved the reduced lifespan seen in PINK1B9 fly (PINK1B9 vs. PINK1B9, PGAM5NP0568 or PINK1B9, PGAM51, p<0.001; wild-type vs. PINK1B9, PGAM5NP0568 or PINK1B9, PGAM51, p<0.01 by the log rank test). (K) Lifespan of adult male PINK1B9 and PINK1B9 ubiquitously overexpressing dPGAM5 flies. Overexpression of dPGAM5 further reduced the lifespan (PINK1B9 vs. PINK1B9; dPGAM5 Tg, p<0.001). The same files were used in (A–F, H and J) and in (G, I and K). The genotypes and the number used in the assays are; wild-type (PINK1RV/Y, n = 161), PGAM5NP0568 (PGAM5NP0568/Y, n = 161), PGAM51 (PGAM51/Y, n = 161), PINK1B9 (PINK1B9/Y, n = 101), PINK1B9, PGAM5NP0568 (PINK1B9, PGAM5NP0568/Y, n = 162) and PINK1B9, PGAM51 (PINK1B9, PGAM51/Y, n = 160) in (A–F, H and J), PINK1B9 (PINK1B9/Y; Da-GAL4/+, n = 162) and PINK1B9, dPGAM5 Tg (PINK1B9/Y; Da-GAL4> UAS-dPGAM5, n = 161) in (G, I and K).
Figure 6
Figure 6. Loss of dPGAM5 improves degeneration of the mitochondria and DA neurons caused by dPINK1 inactivation in Drosophila.
(A–F) TEM analysis of the indirect flight muscle and morphology of mitochondria in 2-day-old adult flies with the indicated genotypes. In A and B, some mitochondria are outlined with broken lines. The insets in D–F show representative mitochondria matrixes. Scale bars  = 1 µm in A–C and 200 nm in D–F. (G) Quantification of the percentage of mitochondrial size distribution in the indirect muscle tissue from wild-type (n = 136 from 5 adult flies), PINK1B9 (n = 96 from 5), PINK1B9, PGAM5NP0568 (n = 116 from 5), PINK1B9, PGAM51 (n = 111 from 5) as shown in Figure 3K. Data are shown as means ± SE (* p<0.05, **p<0.01). (H–J) Quantification of the percentage of cytoplasmic mitochondrial aggregates with diameter of 0.5–1.0, 1.0–1.5 or ≥1.5 µm in each PPL1 TH+ neuron from wild-type (n = 373 from 18 adult flies), PGAM51 (n = 356 from 18), PINK1B9 (n = 231 from 11), PINK1B9PGAM51 flies (n = 235 from 13). Mitochondrial morphology was revealed by mitoGFP as shown in Figure 3L–3O. Data are shown as means ± SE (*, p<0.05;**, p<0.01; N.S., not significant). Tubular or reticular mitochondria were excluded from the estimation due to difficulty in the counting. However, the ratio of mitochondria with that morphology was also increased in PINK1B9PGAM51 flies (J) compared with that in PINK1B9 flies (I). Arrowheads in (J) indicate representative tubular or reticular mitochondria. Scale bar in (I)  = 5 µm. (K) Quantification of TH+ DA neuron number in the PPM1, PPM2 and PPL1 clusters in 25-day-old males. PPM1 and PPM2 cluster neurons were counted together. Data are shown as means ± SE (*, p<0.05; n = 16). (L, M) Representative images of PPM1/2, PPM3 and PPL1 clusters of PINK1B9 (L) and PINK1B9, PGAM5NP0568 flies (M) visualized with anti-TH antibody. Scale bar in (M)  = 50 µm. The genotypes are: PINK1RV/Y (wild-type), PINK1B9/Y (PINK1B9), PGAM5NP0568/Y (PGAM5NP0568), PGAM51/Y (PGAM51), PINK1B9, PGAM5NP0568/Y (PINK1B9, PGAM5NP0568), PINK1B9, PGAM51/Y (PINK1B9, PGAM51), PINK1B9/Y; Da-GAL4> dPGAM5 (PINK1B9, PGAM5 Tg), in (A–G, K–M), PINK1RV/Y; TH-GAL4> mitoGFP (wild-type), PINK1B9/Y; TH-GAL4> mitoGFP (PINK1B9), PGAM51/Y; TH-GAL4> mitoGFP (PGAM51), PINK1B9, PGAM51/Y; TH-GAL4> mitoGFP (PINK1B9, PGAM51) in (H–J).
Figure 7
Figure 7. Disruption of dPGAM5 fails to suppress the mitochondrial phenotype caused by dParkin inactivation in Drosophila.
The abnormal wing posture caused by a homozygous dParkin mutation (A) was not suppressed by removal of the dPGAM5 gene (B). (C) Percentage of flies with abnormal wing posture among 10- and 20-day-old male wild-type (n = 105), parkinP21 (n = 102) and PGAM5NP0568; parkinP21 (n = 109) flies. Error bars show S.E. from three repeated experiments. *, p<0.05; **, p<0.01 vs. dParkin(+/+). (D) Percentage of flies showing locomotor activity among 10- and 20-day-old male parkinP21 (n = 86), parkinP21 (n = 73) and PGAM5NP0568; parkinP21 (n = 78) flies. Error bars show S.E. from twenty repeated experiments. *, p<0.05; **, p<0.01 vs. dParkin(+/+). (E) Locomotor activity of 10-day-old male parkinP21 (n = 153) and parkinP21 ubiquitously overexpressing dPGAM5 flies (parkinP21; dPGAM5 Tg, n = 155) flies. Error bars show S.E. from twenty repeated experiments. **, p<0.01. (F) Lifespan of adult male wild-type (n = 104), parkinP21 (n = 102) and PGAM5NP0568; parkinP21 (n = 91) flies. PGAM5NP0568; parkinP21 vs. parkinP21, p = 0.191; wild-type vs. parkinP21, p<0.001 by log rank test. (G) Lifespan of adult male parkinP21 (n = 153) and parkinP21; dPGAM5 Tg flies (n = 155) flies. parkinP21 vs. parkinP21; dPGAM5 Tg, p<0.001 by log rank test. (H–K) TEM analysis of the indirect flight muscle and mitochondrial morphology in tissue from flies of the indicated genotypes. The long tubular mitochondrial phenotype seen in parkinP21 flies can be rescued by dPGAM5 inactivation (H and I). However, the mitochondrial matrix still appears degenerated (insets in J and K). Scale bars  = 1 µm in H and I and 200 nm in J and K. (L) Quantification of the percentage of mitochondrial size distribution in the indirect muscle tissue from wild-type (n = 136 from 5 adult flies), parkinP21 (n = 89 from 5) and parkinP21; PGAM5NP0568 flies (n = 84 from 5) as shown in (H–K). The length of the mitochondria in the direction of the myofibrils was measured. Data are shown as means ± SE (* p<0.05, **p<0.01 vs. wild-type; # p<0.05 vs. parkinP21; PGAM5NP0568). The genotypes are: +/Y (wild-type), +/Y; parkinP21/parkinP21 (parkinP21), PGAM5NP0568/Y; parkinP21/parkinP21 (parkinP21; PGAM5NP0568).
Figure 8
Figure 8. Reduction of Keap1 activity improves the lifespan of dPINK1 RNAi flies.
Removal of one copy of Drosophila keap1 had no effects on the wing phenotype of dPINK1 RNAi flies (A) but improved viability (B). *, p<0.05; **, p<0.01 vs. age-matched dPINK1 RNAi group. The genotypes are as follows: MHC-GAL4> dPINK1RNAi (+/+), MHC-GAL4> dPINK1RNAi/KeapEY1 (KeapEY1), MHC-GAL4> dPINK1RNAi/KeapEY5 (KeapEY5). Flies were raised at 29°C.
Figure 9
Figure 9. Schematic of the proposed PINK1/PGAM5 pathways in Drosophila.
(A) PGAM5 has a role in mitochondrial activities independently of Parkin downstream of PINK1. (B) PGAM5 negatively regulates Parkin downstream of PINK1.

References

    1. Kitada T, Asakawa S, Hattori N, Matsumine H, Yamamura Y, et al. Mutations in the parkin gene cause autosomal recessive juvenile parkinsonism. Nature. 1998;392:605–608. - PubMed
    1. Valente EM, Abou-Sleiman PM, Caputo V, Muqit MM, Harvey K, et al. Hereditary early-onset Parkinson's disease caused by mutations in PINK1. Science. 2004;304:1158–1160. - PubMed
    1. Unoki M, Nakamura Y. Growth-suppressive effects of BPOZ and EGR2, two genes involved in the PTEN signaling pathway. Oncogene. 2001;20:4457–4465. - PubMed
    1. Imai Y, Soda M, Takahashi R. Parkin suppresses unfolded protein stress-induced cell death through its E3 ubiquitin-protein ligase activity. J Biol Chem. 2000;275:35661–35664. - PubMed
    1. Shimura H, Hattori N, Kubo S, Mizuno Y, Asakawa S, et al. Familial Parkinson disease gene product, parkin, is a ubiquitin-protein ligase. Nat Genet. 2000;25:302–305. - PubMed

Publication types

MeSH terms