

Assessing computational methods of cis-regulatory module prediction
- PMID: 21152003
- PMCID: PMC2996316
- DOI: 10.1371/journal.pcbi.1001020
Assessing computational methods of cis-regulatory module prediction
Abstract
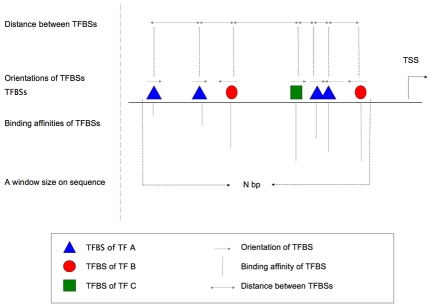
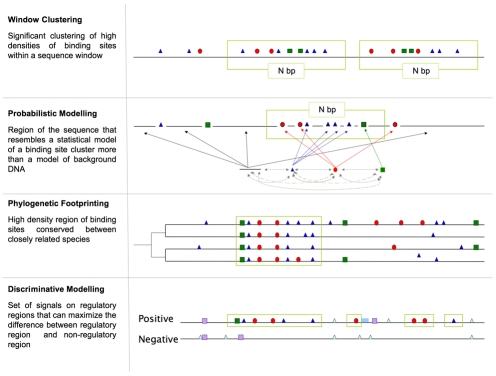
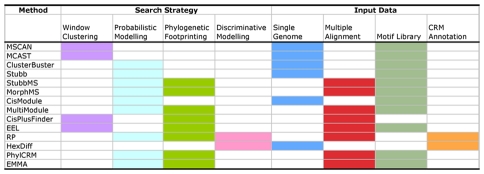
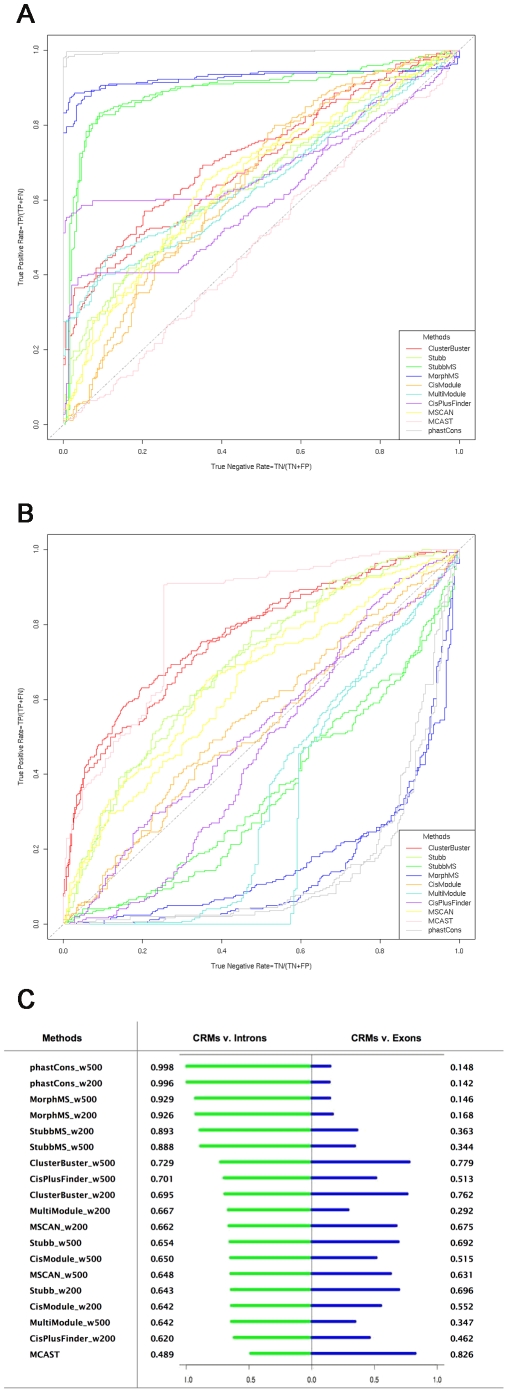
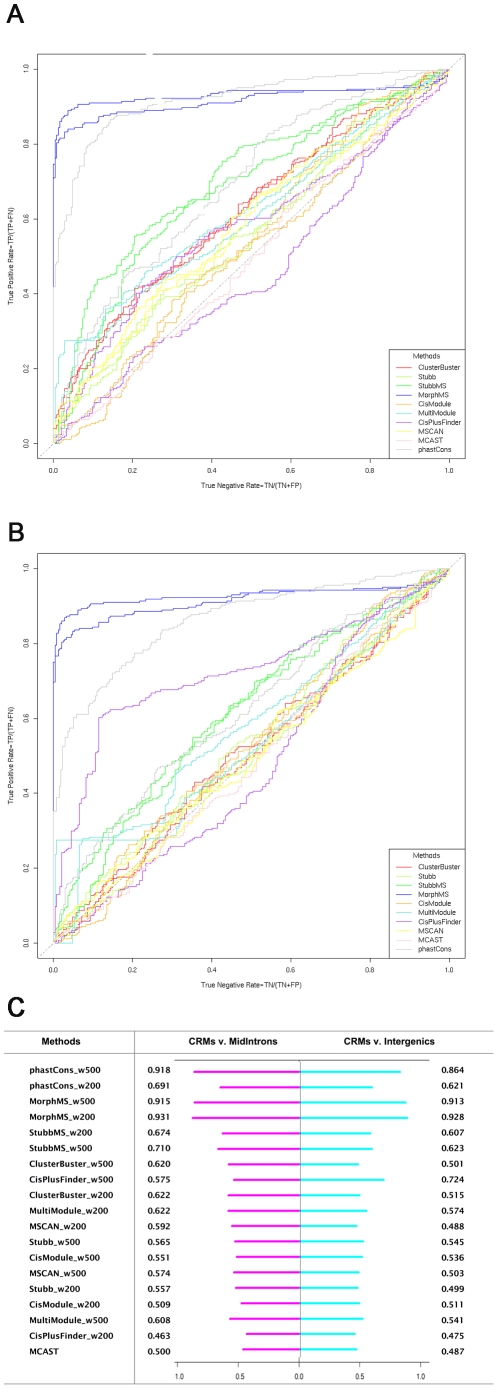
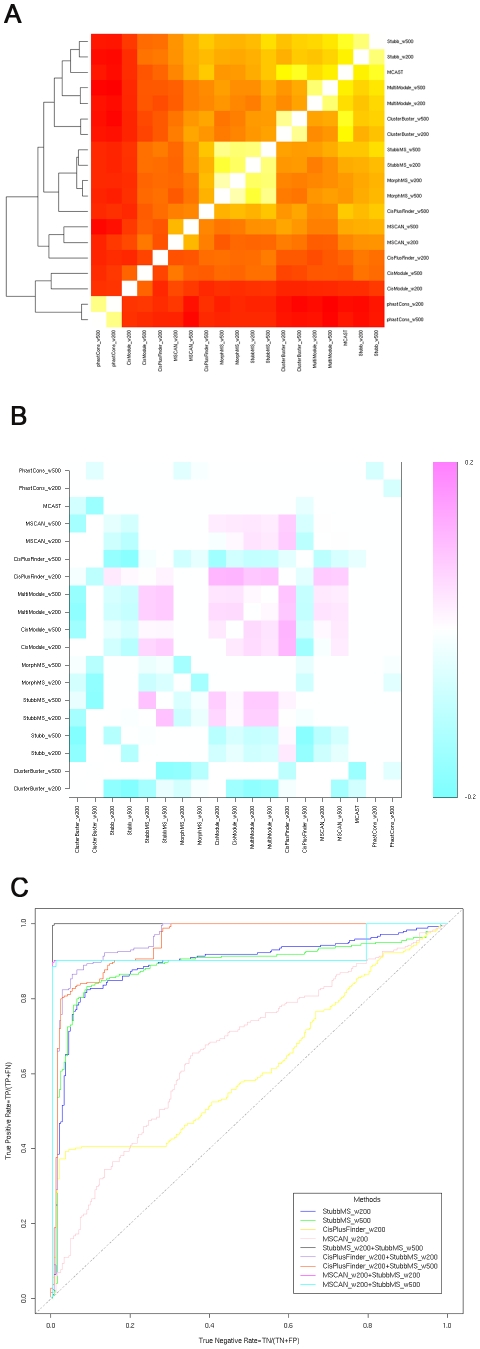
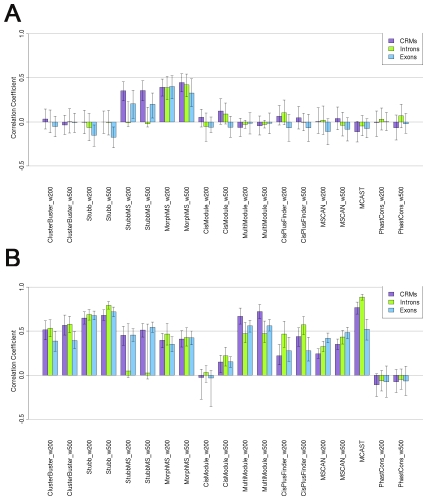
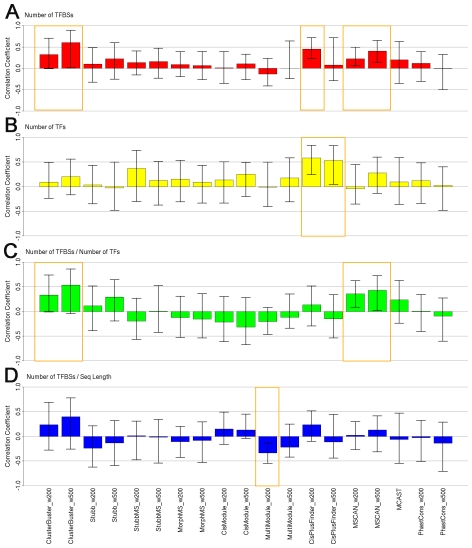
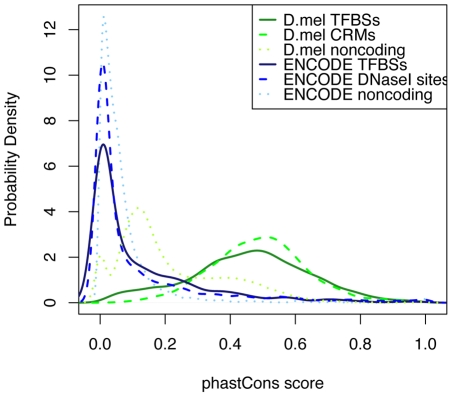
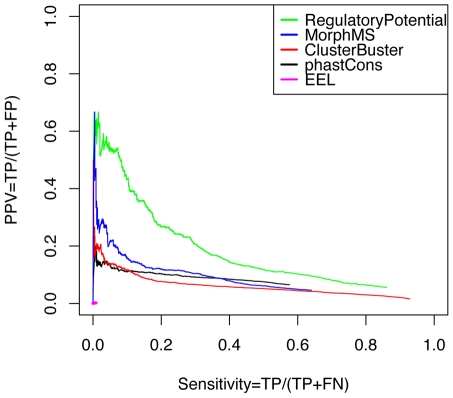
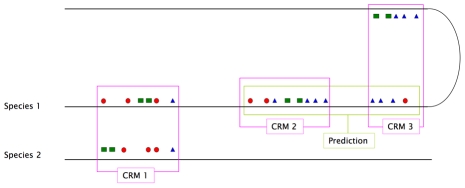
Computational methods attempting to identify instances of cis-regulatory modules (CRMs) in the genome face a challenging problem of searching for potentially interacting transcription factor binding sites while knowledge of the specific interactions involved remains limited. Without a comprehensive comparison of their performance, the reliability and accuracy of these tools remains unclear. Faced with a large number of different tools that address this problem, we summarized and categorized them based on search strategy and input data requirements. Twelve representative methods were chosen and applied to predict CRMs from the Drosophila CRM database REDfly, and across the human ENCODE regions. Our results show that the optimal choice of method varies depending on species and composition of the sequences in question. When discriminating CRMs from non-coding regions, those methods considering evolutionary conservation have a stronger predictive power than methods designed to be run on a single genome. Different CRM representations and search strategies rely on different CRM properties, and different methods can complement one another. For example, some favour homotypical clusters of binding sites, while others perform best on short CRMs. Furthermore, most methods appear to be sensitive to the composition and structure of the genome to which they are applied. We analyze the principal features that distinguish the methods that performed well, identify weaknesses leading to poor performance, and provide a guide for users. We also propose key considerations for the development and evaluation of future CRM-prediction methods.
Conflict of interest statement
The authors have declared that no competing interests exist.
Figures
Similar articles
-
cisMEP: an integrated repository of genomic epigenetic profiles and cis-regulatory modules in Drosophila.BMC Syst Biol. 2014;8 Suppl 4(Suppl 4):S8. doi: 10.1186/1752-0509-8-S4-S8. Epub 2014 Dec 8. BMC Syst Biol. 2014. PMID: 25521507 Free PMC article.
-
Identifying cis-regulatory modules by combining comparative and compositional analysis of DNA.Bioinformatics. 2006 Dec 1;22(23):2858-64. doi: 10.1093/bioinformatics/btl499. Epub 2006 Oct 10. Bioinformatics. 2006. PMID: 17032682
-
A statistical fat-tail test of predicting regulatory regions in the Drosophila genome.Comput Biol Med. 2012 Sep;42(9):935-41. doi: 10.1016/j.compbiomed.2012.07.007. Epub 2012 Aug 9. Comput Biol Med. 2012. PMID: 22884312
-
Computational methods for the detection of cis-regulatory modules.Brief Bioinform. 2009 Sep;10(5):509-24. doi: 10.1093/bib/bbp025. Epub 2009 Jun 4. Brief Bioinform. 2009. PMID: 19498042 Review.
-
REDfly: An Integrated Knowledgebase for Insect Regulatory Genomics.Insects. 2022 Jul 11;13(7):618. doi: 10.3390/insects13070618. Insects. 2022. PMID: 35886794 Free PMC article. Review.
Cited by
-
A statistical thin-tail test of predicting regulatory regions in the Drosophila genome.Theor Biol Med Model. 2013 Feb 14;10:11. doi: 10.1186/1742-4682-10-11. Theor Biol Med Model. 2013. PMID: 23409927 Free PMC article.
-
Identifying transcriptional cis-regulatory modules in animal genomes.Wiley Interdiscip Rev Dev Biol. 2015 Mar-Apr;4(2):59-84. doi: 10.1002/wdev.168. Epub 2014 Dec 29. Wiley Interdiscip Rev Dev Biol. 2015. PMID: 25704908 Free PMC article. Review.
-
Annotating the Insect Regulatory Genome.Insects. 2021 Jun 29;12(7):591. doi: 10.3390/insects12070591. Insects. 2021. PMID: 34209769 Free PMC article. Review.
-
LOESS correction for length variation in gene set-based genomic sequence analysis.Bioinformatics. 2012 Jun 1;28(11):1446-54. doi: 10.1093/bioinformatics/bts155. Epub 2012 Apr 5. Bioinformatics. 2012. PMID: 22492312 Free PMC article.
-
Integrating motif, DNA accessibility and gene expression data to build regulatory maps in an organism.Nucleic Acids Res. 2015 Apr 30;43(8):3998-4012. doi: 10.1093/nar/gkv195. Epub 2015 Mar 19. Nucleic Acids Res. 2015. PMID: 25791631 Free PMC article.
References
-
- Davidson E. The Regulatory Genome: Gene Regulatory Networks in Development and Evolution. San Diego (California): Academic Press/Elsevier; 2006.
-
- Wasserman WW, Sandelin A. Applied bioinformatics for the identification of regulatory elements. Nat Rev Genet. 2004;5:276–287. - PubMed
-
- Gompel N, Prud'homme B, Wittkopp PJ, Kassner VA, Carroll SB. Chance caught on the wing: cis-regulatory evolution and the origin of pigment patterns in Drosophila. Nature. 2005;433:481–487. - PubMed
Publication types
MeSH terms
Substances
Grants and funding
LinkOut - more resources
Full Text Sources
Other Literature Sources
Molecular Biology Databases
