. 2010 Dec 2;6(12):e1001024.
doi: 10.1371/journal.pcbi.1001024.

A systems model for immune cell interactions unravels the mechanism of inflammation in human skin

Affiliations

A systems model for immune cell interactions unravels the mechanism of inflammation in human skin

Najl V Valeyev et al. PLoS Comput Biol. .

Abstract

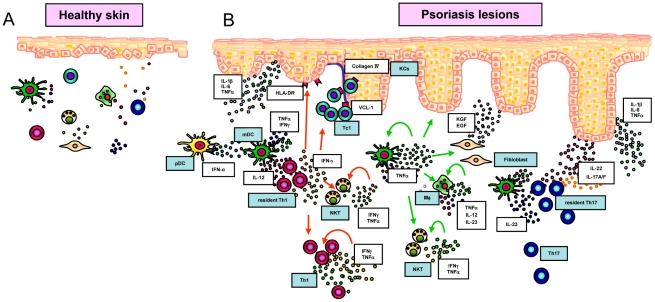
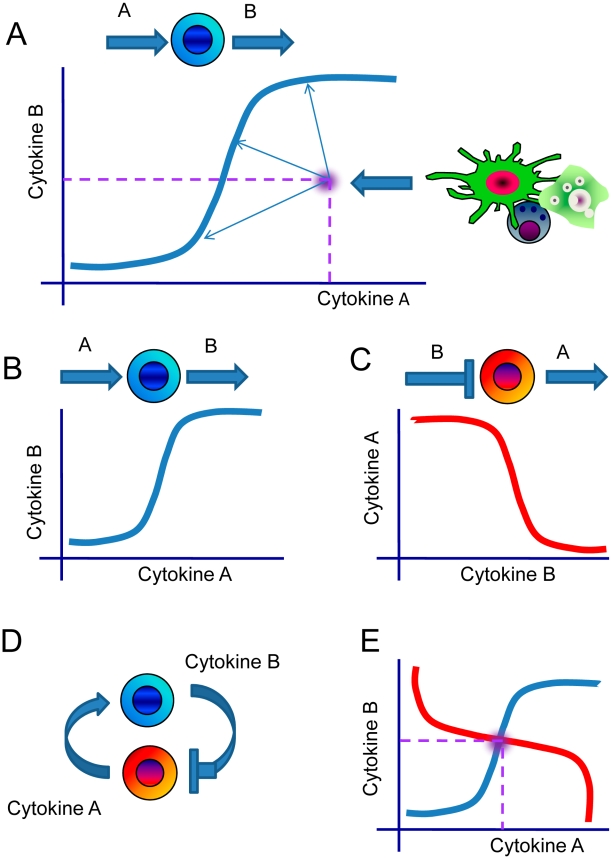
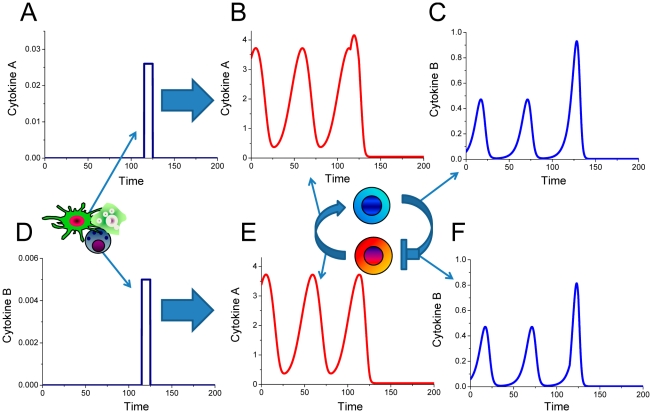
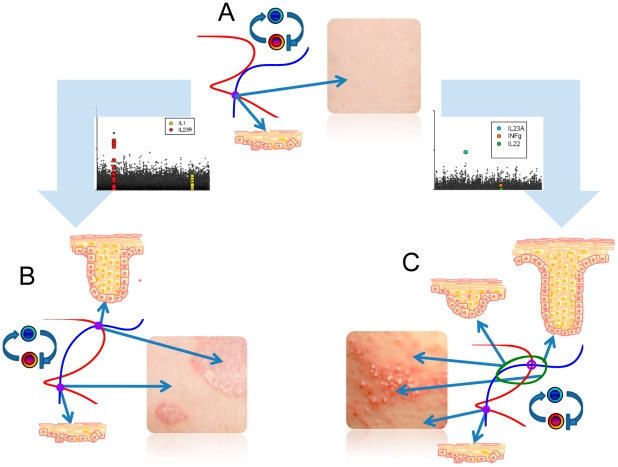
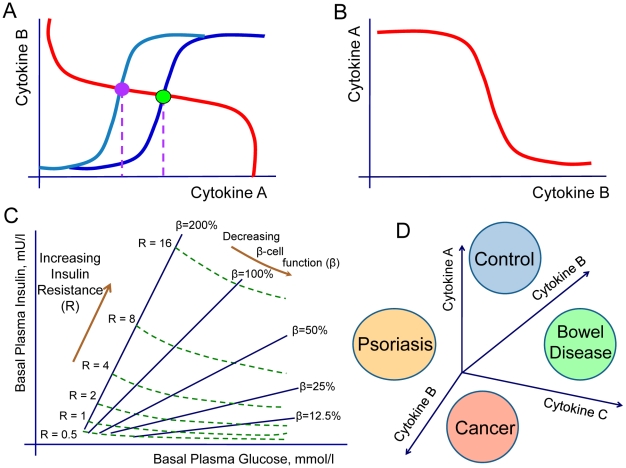
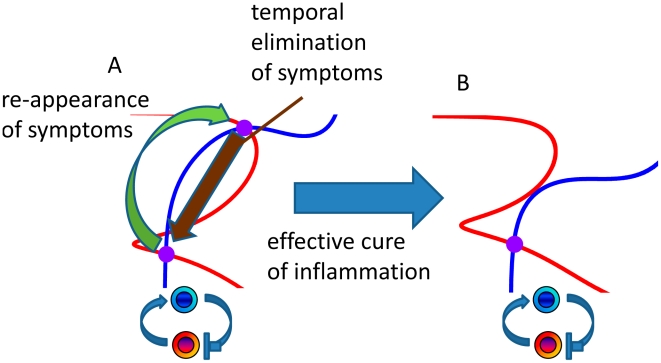
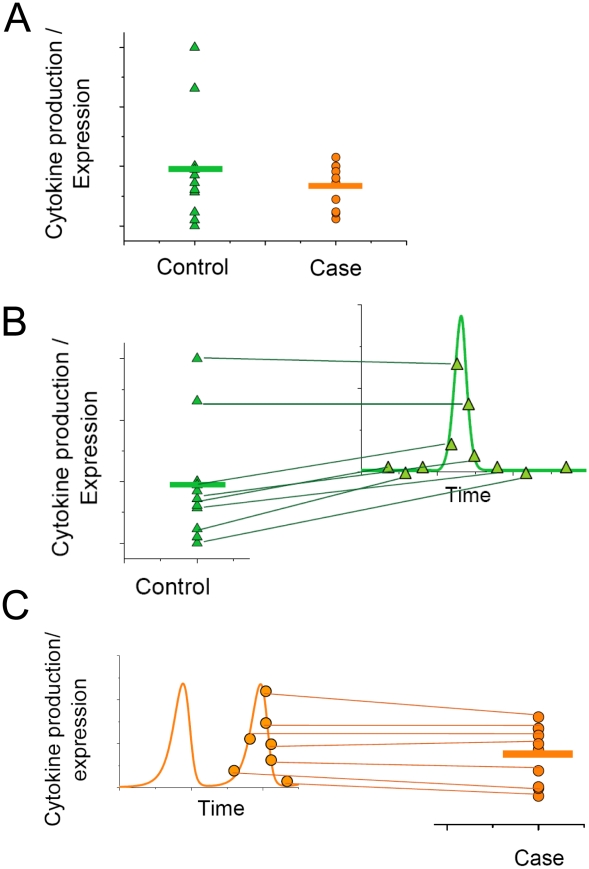
Inflammation is characterized by altered cytokine levels produced by cell populations in a highly interdependent manner. To elucidate the mechanism of an inflammatory reaction, we have developed a mathematical model for immune cell interactions via the specific, dose-dependent cytokine production rates of cell populations. The model describes the criteria required for normal and pathological immune system responses and suggests that alterations in the cytokine production rates can lead to various stable levels which manifest themselves in different disease phenotypes. The model predicts that pairs of interacting immune cell populations can maintain homeostatic and elevated extracellular cytokine concentration levels, enabling them to operate as an immune system switch. The concept described here is developed in the context of psoriasis, an immune-mediated disease, but it can also offer mechanistic insights into other inflammatory pathologies as it explains how interactions between immune cell populations can lead to disease phenotypes.


Conflict of interest statement

The authors have declared that no competing interests exist.

Figures

Figure 1
Figure 1. The schematic diagram for major cell populations involved in skin inflammation.
A. Normal human skin contains a number of immune cells, including dendritic cells and macrophages that operate as sentinels. They are receptive to invading pathogens or other forms of physical, chemical or genetic damage. Upon activation, certain sub-populations of dendritic cells and macrophages attract and initiate numerous effector systems of the innate and adaptive immune systems. Locally activated immune system is characterised by inflamed tissue due to the increased cytokine concentrations. False activation of the immune system can lead to a number of pathologies, for example, psoriasis. B. Psoriasis is initiated by a number of factors such physical trauma, infection and drugs. The initial phase of developing psoriatic lesions is characterized by production of a large amount of IFN-γ by plasmacytoid dendritic cells (pDC). IFN-γ activates dermal myeloid dendritic cells (mDC) and initiates their migration to the local lymph node. In the lymph node mDCs induce proliferation and priming of antigen-specific T cells. mDC remaining in the dermis produce iNOS, IL-12, IL-23, and TNF-α proinflammatory cytokines. These cytokines initiate a chain of immune system reactions. The interactions between dendritic cells, lymphocytes and keratinocytes, create an area of persistent inflammation that can remain for a significant period of time. Human skin under inflammatory conditions contains increased numbers of immune cell populations and elevated levels of cytokines. The elevated concentrations of cytokines can remain for significant periods of time. While the same cells and elevated cytokine concentrations are observed in healthy skin, the major characteristic of pathology is the multifold increase of cell numbers and persistent maintenance of high cytokine concentrations. In response to inflammatory conditions keratinocytes undergo hyperproliferation and aberrant differentiation.
Figure 2
Figure 2. Comparison of normal and inflamed skin samples.
Histology of psoriatic plaque (B) is compared with normal skin (A). Psoriatic plaque (B) is characterized by a hyperproliferative epidermal layer that contains a fourfold larger number of epidermal cells. C. Association significance for psoriasis is shown for the key inflammatory cytokines in the whole genome-wide context. It can be observed that the major cytokines IL22, INFγ, IL1, IL17A and IL6 cytokines do not meet the significance threshold. Genome-wide association of each SNP is plotted as the −log10 (P) dependence on the genomic location (in Mbp) using the coordinates of the NCBI Build 36.1 (March 2006). The association of the SNPs located within the 2 Mbp window centered at the selected inflammatory cytokines is shown in color for individual cytokines. D. The comparison of IL-22 concentration in healthy and psoriatic skin samples . Although the genetic variant of IL-22 cytokine does not meet the association significance threshold (C), it is clearly present at higher concentrations in psoriatic skin samples. E. Opposite to the IL-22 example, the 2 Mbp region located at the IL-10 cytokine gene contains one of the 5% most significant SNP associated with psoriasis (C). However, the production of IL-10 does not significantly differ in healthy and inflamed skin . The comparison of the association significance SNPs in the IL-22 and IL-10 cytokines and the actual cytokine concentrations in the skin shows that the GWAS and cytokine production/expression comparison between controls and cases may lead to conflicting conclusions.
Figure 3
Figure 3. The dose-dependent production of IL-17 cytokine as a function of extracellular IL-23 concentration.
Cytokine production rates by immune cell populations are measured at physiological, but often random background cytokine concentrations. This example illustrates that arbitrary choice of the background cytokine cocktail conditions (in this case IL-23) may lead to different IL-17 production results. A. IL-17 production by bone-derived marrow fibroblasts depends on IL-23 concentration, both important pro-inflammatory cytokines (concentration profiles adopted from [38]). Three random choices of background IL-23 concentration within the physiological range are indicated by dotted lines together with the relevant IL-17 concentrations. The possibility of conflicting IL-17 roles in disease is demonstrated by a comparison of higher (B) and lower (C) IL-17 production rates in the same cell population which is not attributed to either statistically significant SNPs in IL-17 or IL-23 genes or statistically significant alteration of cytokine expression levels. Instead, randomly chosen concentrations of physiologically important cytokines result in such dramatically different conclusions for the roles of pro- or anti-inflammatory cytokines. D. The graph adopted from shows the T-cell proliferation rate as a function of the IL-2 concentration. This example suggests that the dose-dependent cytokine production by an immune cell population in skin can be due to the intrinsic cytokine-dependent properties of immune cells, but it is also modulated by dependence on proliferative and apoptotic phenomena on external cytokine concentrations in a dose-dependent manner.
Figure 4
Figure 4. Dose-dependent cytokine production defines the homeostatic cytokine concentration.
A. Cytokine B production by a cell population as a function of cytokine A concentration defines a continuous line of “homeostasis” for a given immune cell population, where for each concentration of cytokine A corresponds concentration of cytokine B produced by the specified cells. However, other immune cells in the tissue can also produce either or both cytokines A and B so that the combination of the A and B cytokine concentrations in tissue is no longer on the “homeostasis” line. Under normal conditions, the system has to return to a point of homeostasis on the “homeostatic” line. The point of homeostasis can be unambiguously defined by the superimposition of two interacting cell populations: one population produces cytokine B and has receptors to cytokine A (B) and another produces cytokine B in cytokine A-dependent manner (C). Simultaneous consideration of two interdependent cell populations (D) with the superimposition of the cytokine-cytokine dose-dependent curves (E) shows that the point of crossing is the only point where the homeostasis is achieved both “opposite” cell populations.
Figure 5
Figure 5. Systems model predictions for immune sub-system response containing two interdependent immune cell populations.
A. Phase diagram shows simulated lines (red and blue) of homeostasis for two cell populations. The intersection of the cytokine dose-dependent curves defines the stable steady-state solution that represents the homeostatic concentrations for cytokines A and B as indicated by the violet dotted lines. The green lines describe the trajectories of A and B cytokine alterations from any non-homeostatic combinations of A and B concentrations. Arrowheads indicate the directions of the cytokine concentration alterations towards the homeostatic point of equilibrium from any nonequilibrium combination of cytokine concentrations, as predicted by the systems model. B. When an immune system in homeostasis is exposed to external or internal temporal cytokine application, it responds by generating a cytokine impulse. The response of interdependent cell population to small external perturbation can be introduced by other immune cells. The green lines show the trajectories of cytokine concentration divergence from homeostasis in response to small and transient external cytokine A impulses. Trajectories 1 and 3 occur in response to smallest and largest cytokine A applications, respectively. C. The largest external perturbation leading to trajectory 3 on (B). D. The immune sub-system cytokine A and B spikes, generated in response to the external cytokine A spike on (C). The comparison of the impulse applied and the response generated shows clearly that a relatively small application of cytokine A can generate an impulse nearly two orders of magnitude larger compare to the applied spike. Such model prediction suggests that (i) an immune system can amplify inflammatory signals and (ii) even a healthy system can experience a significant, but transitory, elevation of cytokine concentrations above homeostatic levels.
Figure 6
Figure 6. The systems model predicts the cytokine trigger dynamics.
Internal or external factors can change the cytokine production profiles and thereby modify the immune cell interaction parameters via feedback loops. A. The nullcline diagram shows the possibility for two interacting immune cell populations to have multiple levels homeostasis as indicated by the intersections of the red and blue cytokine dose-response curves. The two filled circles represent stable solutions, whereas the hollow circle indicates the unstable solution. The green lines describe how the system converges into the stable homeostatic from any non-homeostatic combination of cytokine concentrations. B. The mathematical model predicts that an immune sub-system can switch between the states of stable low and high cytokine concentrations. The trajectory 1 shows the transition from the lower to higher homeostatic points in response to the external cytokine A impulse, whereas the transition from the higher to the lower homeostatic point occurs after the application of the external cytokine B as indicated by the trajectory 2. The time course of cytokine alterations during the transition from the low to high concentration states in response to the external cytokine A impulse (C) is shown on (D). The cytokine concentration dynamics during the switch from the higher to the lower homeostasis states in response to the external impulse of cytokine B (E) is shown on (F).
Figure 7
Figure 7. Oscillatory cytokine concentration dynamics.
Internal or external factors can alter the cytokine production profiles and thereby modify the immune cell interaction parameters via feedback loops. Such modification can lead not only to the shift or appearance of new levels of homeostasis, but also to the loss of homeostatic stability with the appearance of limit cycles. A. The nullcline diagram shows the multiple homeostasis solutions as indicated by the intersections of the red and blue cytokine dose-response curves. The filled circle represents a stable solution, whereas the hollow circles demonstrate unstable solutions. One of the unstable solutions forms a limit cycle which represents the possibility for cytokine concentrations to oscillate. The green lines show how the system converges either into the stable homeostatic point or stable oscillations from any other combination of non-homeostatic cytokine concentrations. B. The nullcline diagram describes the case of one unstable solution that forms a limit cycle. C. External perturbations of variable amplitude can shift the system from the stable low cytokine concentration state into the mode of stable oscillations in the higher concentration range, as indicated by trajectory 1. Interestingly, higher amplitude perturbations, applied externally, cause the interdependent cell populations generate large spikes and followed by return to the homeostasis point bypassing the oscillatory mode (trajectory 2). D. An external impulse of small magnitude applied during the oscillatory regime is able to return the system into the basal level of homeostasis.
Figure 8
Figure 8. Temporal evolution of cytokine concentrations in response to applied perturbation.
Variable magnitude impulses of cytokine A (A) and (D) applied to the interacting cell populations can shift the cells from the basal homeostasis point into the mode of stable oscillations (B) and (C) or generate a large spike and return into the homeostasis (E) and (F). The larger perturbation (D) causes the immune cell population system to generate a single impulse instead of undergoing stable oscillations. In both cases the magnitude of the perturbation is significantly smaller compare to the response generated by the interacting immune cells.
Figure 9
Figure 9. Model predictions for the transition from the oscillatory regime into the homeostatic level.
Small external impulses of cytokines A (A) and cytokine B (D) applied for a temporal period of time can switch the immune system from generating stable oscillations back into the level of homeostasis. The dynamics of cytokine concentrations during the transition from the oscillatory mode back into homeostasis after the cytokine A and cytokine B perturbations are shown on (B–C) and (E–F), respectively.
Figure 10
Figure 10. Systems biology description of inflammation in human skin.
(A) Under normal conditions the homeostasis (defined by the dose-dependent cytokine production curve intersection) is reached at one steady-state point at low cytokine concentration levels. Combinations of SNPs and modified cytokine expression levels observed in disease can cause more than one stable (B) or unstable (C) homeostasis. In case of additional stable cytokine level (B), the interacting immune cell populations represent a trigger that can switch and remain in the state of either low or high cytokine concentration levels. When the combination of genetic alterations causes an additional homeostasis point which is unstable with a limit cycle, the cytokine levels can oscillate both locally and spatiotemporally. In such case, the inflammatory cytokines are more likely to be distributed more unevenly across the site of inflammation causing a skin inflammation phenotype of heterogeneous nature (C).
Figure 11
Figure 11. Therapeutic applications of systems model for immune cell interactions.
The systems model for cytokine-mediated immune cell population interactions offers new strategies for development of pharmaceutical interventions. A. The altered cytokine production profiles lead to the modification of feedback parameters between immune cell populations. Modified feedback changes the level of steady-state homeostatic for individual cytokines. The lower and higher homeostatic concentrations for the cytokine A, indicated by violet and green circles, take place for two dose-dependent cytokine profiles from normal and pathologic immune cell populations. In this case, potential therapeutic strategies may focus on identification such compounds that will rescue the original cytokine production profile. B. The interdependence of cytokines via cell populations suggests new strategies for indirect therapeutic interventions by cytokine injections. In this example, injections of cytokine B are likely to decrease the levels of cytokine A. C. The graph, adopted from , is an example of the computational homeostatic model that model determines the steady-state basal plasma glucose and insulin concentrations by their interaction in a feedback loop. Comparison of a patient's fasting values with the model's predictions allows a quantitative assessment of the contributions of insulin resistance and deficient β-cell function in type II diabetes. D. In analogy with the homeostatic model assessment in type II diabetes (C), the proposed model for immune cell interactions contains predictive potential for quantitative determination of inflammation-related pathologies.
Figure 12
Figure 12. Systems interpretation of pharmacological agent effects on inflamed tissue.
The majority of currently available pharmacological agents allow temporal elimination of inflammatory symptoms. In the context of the proposed systems model, this effect can be considered as a switch from the inflamed to perilesional steady-state (A). While such compounds or antibodies offer temporal relieve from inflammatory symptoms, they do not represent effective means of cure. The new pharmacological agents can be developed and selected on the action that leads to the disappearance of the additional inflammatory level (B).
Figure 13
Figure 13. The dynamics dimension for the data interpretation.
A. The comparison of cytokine production levels between may not provide statistically significant differences between health and pathology. More importantly, the widely used approach does not offer insights into the mechanism of the observed differences. B. The representation of an immune system as a system of interdependent cells interconnected by the cytokine production and degradation mechanisms provides new possibilities of data interpretation. Experimentally observed readout variability can be interpreted as time course points during an immune response. C. The time course perspective shows the possibility of oscillatory cytokine dynamics.

Similar articles

Cited by

References

    1. Yarilin AA, Belyakov IM. Cytokines in the thymus: production and biological effects. Curr Med Chem. 2004;11:447–464. - PubMed
    1. Nickoloff BJ, Xin H, Nestle FO, Qin JZ. The cytokine and chemokine network in psoriasis. Clin Dermatol. 2007;25:568–573. - PubMed
    1. Cutolo M, Bijlsma JW, Lahita RG, Masi AT, Straub RH, et al. Altered neuroendocrine immune (NEI) networks in rheumatology. Ann N Y Acad Sci. 2002;966:xiii–xviii. - PubMed
    1. Pinilla-Ibarz J, Shah B, Dubovsky JA. The biological basis for immunotherapy in patients with chronic myelogenous leukemia. Cancer Control. 2009;16:141–152. - PubMed
    1. Erickson B, Sperber K, Frishman WH. Toll-like receptors: new therapeutic targets for the treatment of atherosclerosis, acute coronary syndromes, and myocardial failure. Cardiol Rev. 2008;16:273–279. - PubMed

Publication types