. 2010 Dec 2;6(12):e1001025.
doi: 10.1371/journal.pcbi.1001025.

Identifying a high fraction of the human genome to be under selective constraint using GERP++

Affiliations

Identifying a high fraction of the human genome to be under selective constraint using GERP++

Eugene V Davydov et al. PLoS Comput Biol. .

Abstract

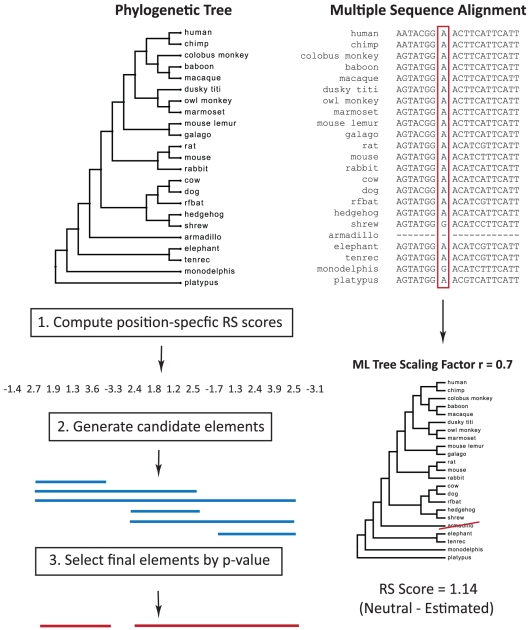
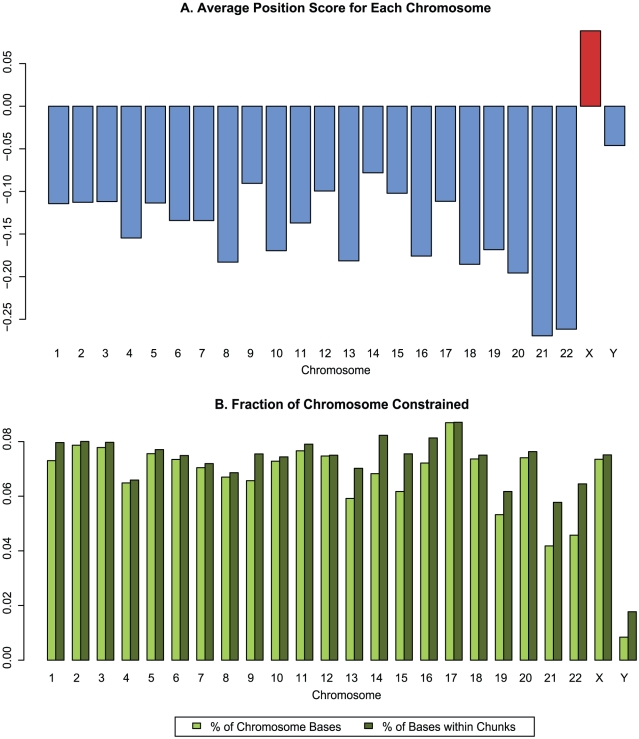
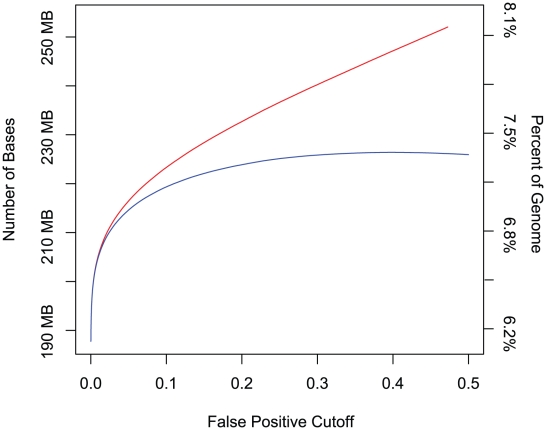
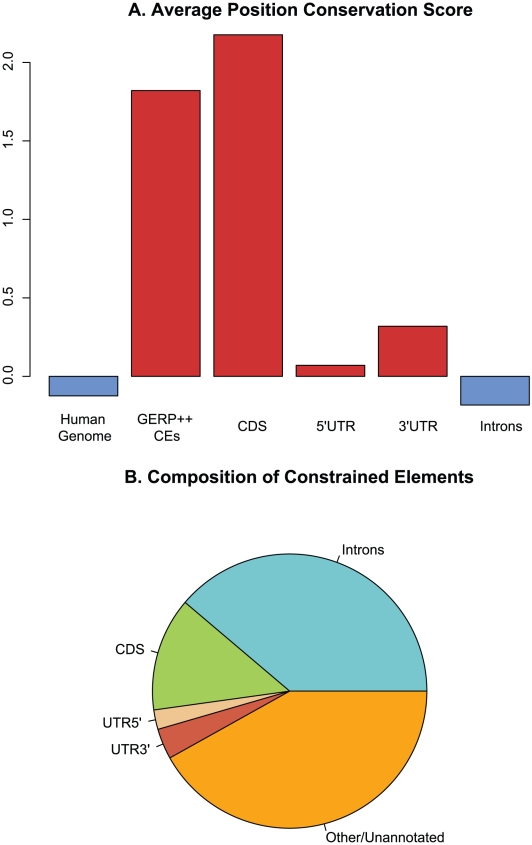
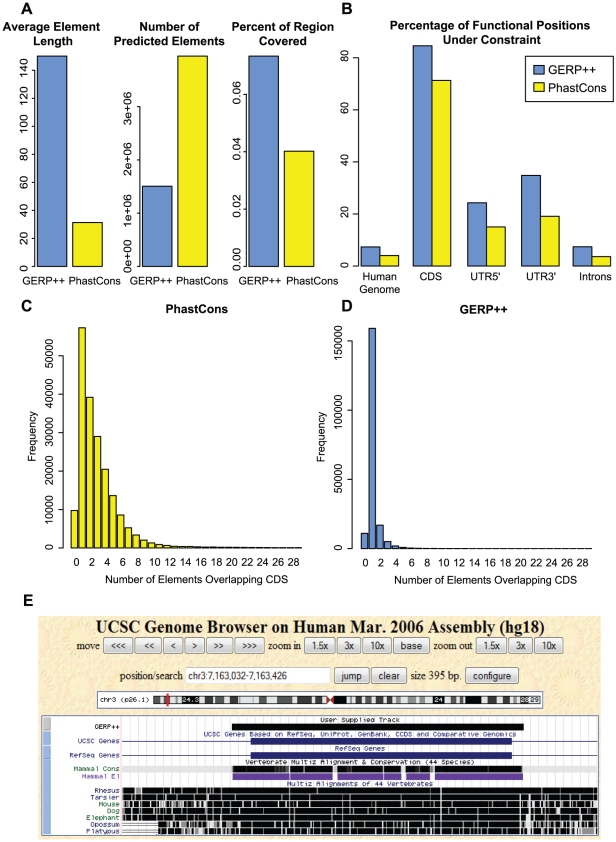
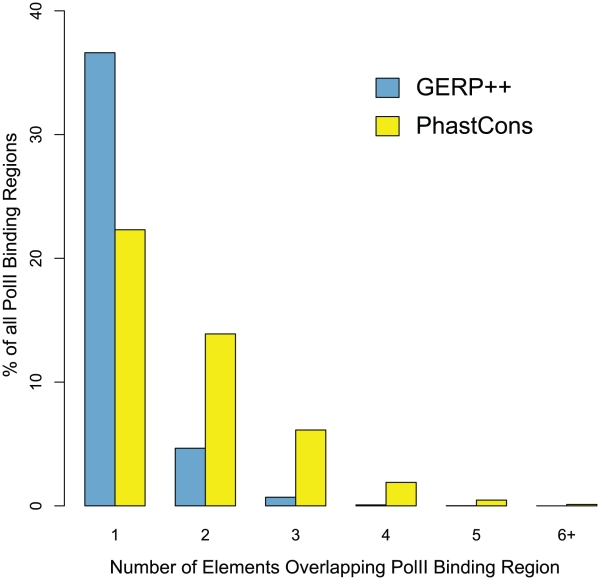
Computational efforts to identify functional elements within genomes leverage comparative sequence information by looking for regions that exhibit evidence of selective constraint. One way of detecting constrained elements is to follow a bottom-up approach by computing constraint scores for individual positions of a multiple alignment and then defining constrained elements as segments of contiguous, highly scoring nucleotide positions. Here we present GERP++, a new tool that uses maximum likelihood evolutionary rate estimation for position-specific scoring and, in contrast to previous bottom-up methods, a novel dynamic programming approach to subsequently define constrained elements. GERP++ evaluates a richer set of candidate element breakpoints and ranks them based on statistical significance, eliminating the need for biased heuristic extension techniques. Using GERP++ we identify over 1.3 million constrained elements spanning over 7% of the human genome. We predict a higher fraction than earlier estimates largely due to the annotation of longer constrained elements, which improves one to one correspondence between predicted elements with known functional sequences. GERP++ is an efficient and effective tool to provide both nucleotide- and element-level constraint scores within deep multiple sequence alignments.


Conflict of interest statement

The authors have declared that no competing interests exist.

Figures

Figure 1
Figure 1. Overview of GERP++.
(1) For each position of the multiple alignment we compute the conservation score in rejected substitutions by subtracting the estimated evolutionary rate from the neutral rate. The neutral rate is computed by removing species gapped at that position from the phylogenetic tree and summing the branch lengths of the resulting projected tree; the evolutionary rate is estimated by computing the maximum likelihood rescaling of the projected tree. (2) Given position-specific conservation scores, we generate a set of candidate elements. (3) For each candidate element, we compute a p-value to represent the likelihood of observing a segment of equal length and greater than or equal score under the null model. We then select a non-overlapping set of elements in order of increasing p-value.
Figure 2
Figure 2. Per-chromosome constraint intensity.
(A) Mean RS score for all alignment positions where evolutionary rate was computed. Note the elevated average score for chromosome X. (B) Fraction of chromosome that falls into predicted constrained elements. Light green bars show fraction of entire chromosome, while dark green bars show fraction adjusted for regions where no rate computation was performed and no elements could span (see Methods).
Figure 3
Figure 3. Estimating detectable constraint.
The red curve represents the number of bases within predicted constrained element as a function of the false positive cutoff parameter. The blue curve represents the number of predicted bases minus the expected number of false positive bases, also as a function of the false positive cutoff.
Figure 4
Figure 4. Relationship between CEs and known functional elements.
(A) Mean rejected substitution scores for entire human genome, constrained elements predicted by GERP++, and known annotated exons, introns, and UTR regions. (B) Breakdown of constrained element positions by region type.
Figure 5
Figure 5. Distributions (smoothed histograms) of 3-periodicity bias for known exons (red), introns (green), CEs that overlap exons (orange), and CEs not overlapping exons (blue).
Figure 6
Figure 6. GERP++ vs phastCons predictions.
(A) Mean length (left), number (middle) and total length (right) of constrained elements predicted by GERP++ (blue) and phastCons(yellow). (B) Nucleotide-level fraction of annotated exons, introns, UTRs and noncoding RNAs genes covered by GERP++ (blue) and phastCons (yellow) predictions. (C&D) Histogram of number of distinct predicted GERP++ (blue, D) and phastCons(yellow, C) constrained elements overlapping each annotated coding exon. Note the difference in scale on the y-axis. (E) A constrained region slightly over 200 base pairs in length that contains a known exon, as annotated by GERP++ (labeled ‘GERP++’, black) and phastCons (purple track labeled ‘Mammal El’). Note how phastCons fragments the exon into multiple CE predictions.
Figure 7
Figure 7. Mean distribution of PolII binding sites by number of overlapping CEs over 9 Encode PolII ChIP experiments, for GERP++ and phastCons.

Similar articles

Cited by

References

    1. Margulies EH, Cooper GM, Asimenos G, Thomas DJ, Dewey CN, et al. Analyses of deep mammalian sequence alignments and constraint predictions for 1% of the human genome. Genome Res. 2007;17:760–774. - PMC - PubMed
    1. The ENCODE Project Consortium. The ENCODE (ENCyclopedia Of DNA Elements) Project. Science. 2004;306:636–640. - PubMed
    1. Birney E, Stamatoyannopoulos JA, Dutta A, Guigo R, Gingeras TR, et al. Identification and analysis of functional elements in 1% of the human genome by the ENCODE pilot project. Nature. 2007;447:799–816. - PMC - PubMed
    1. Siepel A, Bejerano G, Pedersen JS, Hinrichs AS, Hou M, et al. Evolutionarily conserved elements in vertebrate, insect, worm, and yeast genomes. Genome Res. 2005;15:1034–1050. - PMC - PubMed
    1. Cooper GM, Stone EA, Asimenos G, Green ED, Batzoglou S, et al. Distribution and intensity of constraint in mammalian genomic sequence. Genome Res. 2005;15:901–913. - PMC - PubMed

Publication types