Gene expression network reconstruction by convex feature selection when incorporating genetic perturbations
- PMID: 21152011
- PMCID: PMC2996324
- DOI: 10.1371/journal.pcbi.1001014
Gene expression network reconstruction by convex feature selection when incorporating genetic perturbations
Abstract
Cellular gene expression measurements contain regulatory information that can be used to discover novel network relationships. Here, we present a new algorithm for network reconstruction powered by the adaptive lasso, a theoretically and empirically well-behaved method for selecting the regulatory features of a network. Any algorithms designed for network discovery that make use of directed probabilistic graphs require perturbations, produced by either experiments or naturally occurring genetic variation, to successfully infer unique regulatory relationships from gene expression data. Our approach makes use of appropriately selected cis-expression Quantitative Trait Loci (cis-eQTL), which provide a sufficient set of independent perturbations for maximum network resolution. We compare the performance of our network reconstruction algorithm to four other approaches: the PC-algorithm, QTLnet, the QDG algorithm, and the NEO algorithm, all of which have been used to reconstruct directed networks among phenotypes leveraging QTL. We show that the adaptive lasso can outperform these algorithms for networks of ten genes and ten cis-eQTL, and is competitive with the QDG algorithm for networks with thirty genes and thirty cis-eQTL, with rich topologies and hundreds of samples. Using this novel approach, we identify unique sets of directed relationships in Saccharomyces cerevisiae when analyzing genome-wide gene expression data for an intercross between a wild strain and a lab strain. We recover novel putative network relationships between a tyrosine biosynthesis gene (TYR1), and genes involved in endocytosis (RCY1), the spindle checkpoint (BUB2), sulfonate catabolism (JLP1), and cell-cell communication (PRM7). Our algorithm provides a synthesis of feature selection methods and graphical model theory that has the potential to reveal new directed regulatory relationships from the analysis of population level genetic and gene expression data.
Conflict of interest statement
The authors have declared that no competing interests exist.
Figures

 . This gene in turn has an effect on Gene B through an unobserved pathway represented by the ‘Factors’ node. While these factors are unobserved we can still infer that there is a regulatory effect of Gene A on the downstream Gene B, which is represented in our network model by the parameter
  .
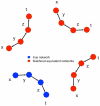
.


 ) using the adaptive lasso algorithm for a Saccharomyces cerevisiae cross between a wild strain and lab strain , with 112 segregants (see text for details). (a) Recovered undirected network among these 35 gene expression products and (b) putative directed network reconstructed for the same genes, based on the edges between cis-eQTL (not shown) and the 35 genes. Bold edges represent directed edges with strong confidence based on a resampling procedure (see text for details).
Similar articles
-
Inference of gene regulatory networks with sparse structural equation models exploiting genetic perturbations.PLoS Comput Biol. 2013;9(5):e1003068. doi: 10.1371/journal.pcbi.1003068. Epub 2013 May 23. PLoS Comput Biol. 2013. PMID: 23717196 Free PMC article.
-
Learning gene networks under SNP perturbations using eQTL datasets.PLoS Comput Biol. 2014 Feb 27;10(2):e1003420. doi: 10.1371/journal.pcbi.1003420. eCollection 2014 Feb. PLoS Comput Biol. 2014. PMID: 24586125 Free PMC article.
-
High-confidence discovery of genetic network regulators in expression quantitative trait loci data.Genetics. 2011 Mar;187(3):955-64. doi: 10.1534/genetics.110.124685. Epub 2011 Jan 6. Genetics. 2011. PMID: 21212238 Free PMC article.
-
Biological Network Inference and analysis using SEBINI and CABIN.Methods Mol Biol. 2009;541:551-76. doi: 10.1007/978-1-59745-243-4_24. Methods Mol Biol. 2009. PMID: 19381531 Review.
-
Zooming in on yeast osmoadaptation.Adv Exp Med Biol. 2012;736:293-310. doi: 10.1007/978-1-4419-7210-1_17. Adv Exp Med Biol. 2012. PMID: 22161336 Review.
Cited by
-
Estimation of high-dimensional directed acyclic graphs with surrogate intervention.Biostatistics. 2020 Oct 1;21(4):659-675. doi: 10.1093/biostatistics/kxy080. Biostatistics. 2020. PMID: 30596892 Free PMC article.
-
Inference of SNP-gene regulatory networks by integrating gene expressions and genetic perturbations.Biomed Res Int. 2014;2014:629697. doi: 10.1155/2014/629697. Epub 2014 Jun 9. Biomed Res Int. 2014. PMID: 25136606 Free PMC article.
-
The Wright stuff: reimagining path analysis reveals novel components of the sex determination hierarchy in Drosophila melanogaster.BMC Syst Biol. 2015 Sep 4;9:53. doi: 10.1186/s12918-015-0200-0. BMC Syst Biol. 2015. PMID: 26335107 Free PMC article.
-
Making the most of "omics" for symbiosis research.Biol Bull. 2012 Aug;223(1):21-9. doi: 10.1086/BBLv223n1p21. Biol Bull. 2012. PMID: 22983030 Free PMC article. Review.
-
An independent component analysis confounding factor correction framework for identifying broad impact expression quantitative trait loci.PLoS Comput Biol. 2017 May 15;13(5):e1005537. doi: 10.1371/journal.pcbi.1005537. eCollection 2017 May. PLoS Comput Biol. 2017. PMID: 28505156 Free PMC article.
References
-
- Emilsson V, Thorleifsson G, Zhang B, Leonardson A, Zink F, et al. Genetics of gene expression and its effect on disease. Nature. 2008;452:423–428. - PubMed
-
- Friedman N, Linial M, Nachman I, Pe'er D. Using Bayesian networks to analyze expression data. J Comput Biol. 2000;7:601–620. - PubMed
-
- Pe'er D, Regev A, Elidan G, Friedman N. Inferring subnetworks from perturbed expression profiles. Bioinformatics. 2001;17:S215. - PubMed
Publication types
MeSH terms
LinkOut - more resources
Full Text Sources
Molecular Biology Databases
Miscellaneous

