. 2010 Nov 30;5(11):e15074.
doi: 10.1371/journal.pone.0015074.

Prognostic biomarkers for esophageal adenocarcinoma identified by analysis of tumor transcriptome

Affiliations

Prognostic biomarkers for esophageal adenocarcinoma identified by analysis of tumor transcriptome

Soo Mi Kim et al. PLoS One. .

Abstract

Background: Despite many attempts to establish pre-treatment prognostic markers to understand the clinical biology of esophageal adenocarcinoma (EAC), validated clinical biomarkers or parameters remain elusive. We generated and analyzed tumor transcriptome to develop a practical biomarker prognostic signature in EAC.

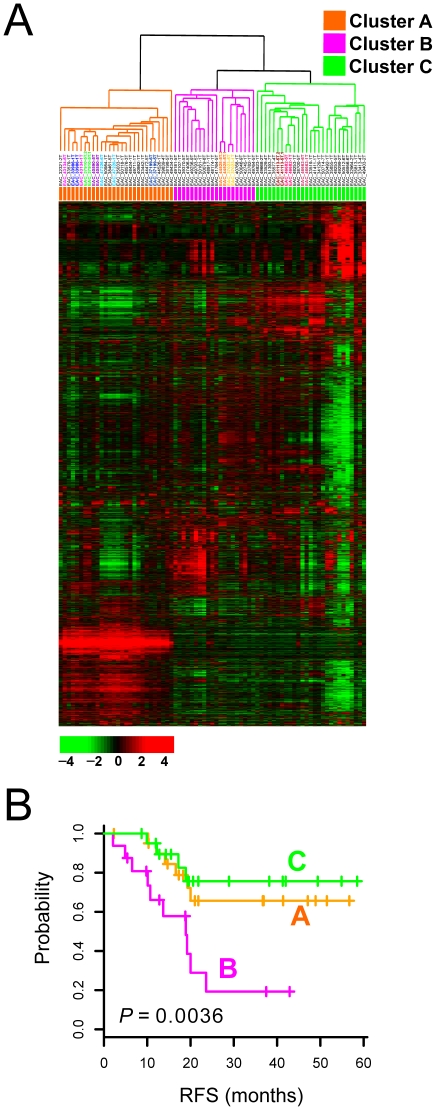
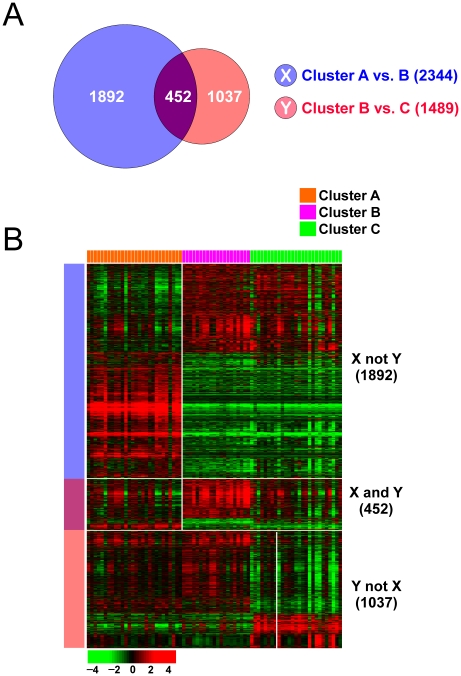
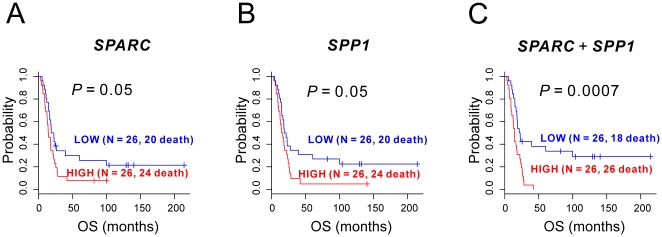
Methodology/principal findings: Untreated esophageal endoscopic biopsy specimens were obtained from 64 patients undergoing surgery and chemoradiation. Using DNA microarray technology, genome-wide gene expression profiling was performed on 75 untreated cancer specimens from 64 EAC patients. By applying various statistical and informatical methods to gene expression data, we discovered distinct subgroups of EAC with differences in overall gene expression patterns and identified potential biomarkers significantly associated with prognosis. The candidate marker genes were further explored in formalin-fixed, paraffin-embedded tissues from an independent cohort (52 patients) using quantitative RT-PCR to measure gene expression. We identified two genes whose expression was associated with overall survival in 52 EAC patients and the combined 2-gene expression signature was independently associated with poor outcome (P<0.024) in the multivariate Cox hazard regression analysis.

Conclusions/significance: Our findings suggest that the molecular gene expression signatures are associated with prognosis of EAC patients and can be assessed prior to any therapy. This signature could provide important improvement for the management of EAC patients.


Conflict of interest statement

Competing Interests: The authors have declared that no competing interests exist.

Figures

Figure 1
Figure 1. Hierarchical clustering analysis.
(A) Hierarchical clustering of genes from 75 EAC tissues. Genes with an expression ratio that was at least twofold different relative to reference in at least 8 tissues were selected for hierarchical analysis (6,802 gene features). The data are presented in matrix format, with rows representing the individual gene and columns representing each tissue. Each cell in the matrix represents the expression level of a gene feature in an individual tissue. Red and green reflect high and low expression levels, respectively, as indicated in the scale bar (log 2 transformed scale). Duplicated biopsies from the same patients were highlighted in colors in dendrogram. (B) Kaplan-Meier plot of disease-free survival of EAC patients grouped on the basis of gene expression profiling.
Figure 2
Figure 2. Cross comparison of gene lists from two independent statistical tests.
(A) Venn Diagram of genes differentially expressed. The blue circle (gene list X) represents genes differentially expressed between cluster A and B. The red circle (gene list Y) represents genes differentially expressed between cluster B and C. Four-hundred-fifty-two genes were shared by the two gene lists. We applied a cut-off P-value of less than 0.002 to retain genes whose expression is significantly different between the two groups of tissues examined. (B) Heat map of gene expression patterns. Blue and pink bars on the left side of the heat map represent each selected genes. Colored bars at the top of the heat map represent the tissues indicated. Expression of genes in the X not Y category was dramatically different between clusters A and B as well as between clusters A and C, but almost no differences were observed between clusters B and C, signifying a unique gene expression signature that distinguishes patients in cluster A from the rest of the patients.
Figure 3
Figure 3. Gene networks from IngenuityTM Pathway Analysis.
Global networks of inter-connection among genes and expression patterns of genes in network #1 in Appendix Table 1. Red and green colors in each shape indicate up- or down-regulation of expression in cluster B when compared with cluster A and C. Genes in gray color are not in the list but associated with the regulated genes. Each line and arrow represents functional and physical interaction and direction of regulation demonstrated in the literature. Genes inter-connected with NF-kB are highlighted in blue lines.
Figure 4
Figure 4. Kaplan-Meier plots of overall survival for EAC patients.
(A) Overall survival by SPARC status in 52 patients. (B) Overall survival by SPP1 status in 52 patients. (C) Overall survival by SPARC+SPP1 in 52 patients.

Similar articles

Cited by

References

    1. Bollschweiler E, Wolfgarten E, Gutschow C, Holscher AH. Demographic variations in the rising incidence of esophageal adenocarcinoma in white males. Cancer. 2001;92:549–555. - PubMed
    1. Mariette C, Balon JM, Piessen G, Fabre S, Van SI, et al. Pattern of recurrence following complete resection of esophageal carcinoma and factors predictive of recurrent disease. Cancer. 2003;97:1616–1623. - PubMed
    1. Brown LM, Devesa SS, Chow WH. Incidence of adenocarcinoma of the esophagus among white Americans by sex, stage, and age. J Natl Cancer Inst. 2008;100:1184–1187. - PMC - PubMed
    1. Jemal A, Siegel R, Ward E, Hao Y, Xu J, Thun MJ. Cancer statistics, 2009. CA Cancer J Clin. 2009;59:225–249. - PubMed
    1. Enzinger PC, Mayer RJ. Esophageal cancer. N Engl J Med. 2003;349:2241–2252. - PubMed

Publication types

MeSH terms

Associated data