. 2010 Nov 30;5(11):e15090.
doi: 10.1371/journal.pone.0015090.

Calpain 2 controls turnover of LFA-1 adhesions on migrating T lymphocytes

Affiliations

Calpain 2 controls turnover of LFA-1 adhesions on migrating T lymphocytes

Lena Svensson et al. PLoS One. .

Abstract

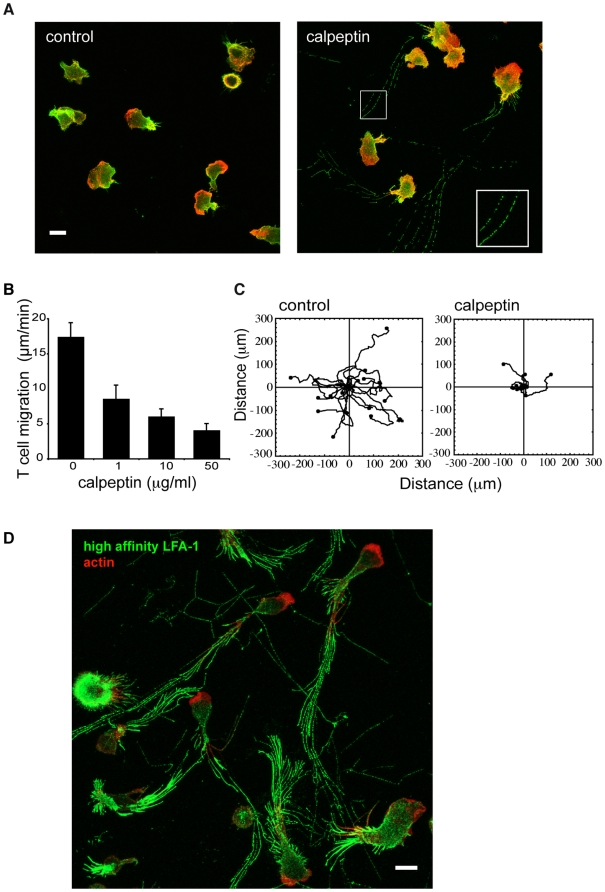
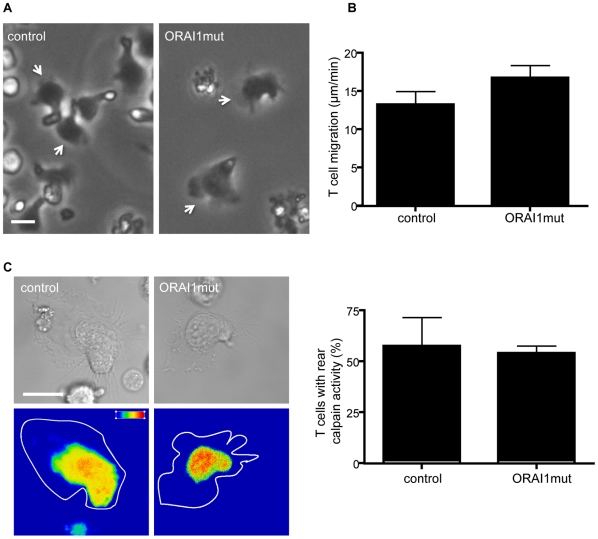
The immune cells named T lymphocytes circulate around the body fulfilling their role in immunosurveillance by monitoring the tissues for injury or infection. To migrate from the blood into the tissues, they make use of the integrin LFA-1 which is exclusively expressed by immune cells. These highly motile cells attach and migrate on substrates expressing the LFA-1 ligand ICAM-1. The molecular events signaling LFA-1 activation and adhesion are now reasonably well identified, but the process of detaching LFA-1 adhesions is less understood. The cysteine protease calpain is involved in turnover of integrin-mediated adhesions in less motile cell types. In this study we have explored the involvement of calpain in turnover of LFA-1-mediated adhesions of T lymphocytes. Using live cell imaging and immunohistochemistry, we demonstrate that turnover of adhesions depends on the Ca2+-dependent enzyme, calpain 2. Inhibition of calpain activity by means of siRNA silencing or pharmacological inhibition results in inefficient disassembly of LFA-1 adhesions causing T lymphocyte elongation and shedding of LFA-1 clusters behind the migrating T lymphocytes. We show that calpain 2 is distributed throughout the T lymphocyte, but is most active at the trailing edge as detected by expression of its fluorescent substrate CMAC,t-BOC-Leu-Met. Extracellular Ca2+ entry is essential for the activity of calpain 2 that is constantly maintained as the T lymphocytes migrate. Use of T cells from a patient with mutation in ORAI1 revealed that the major calcium-release-activated-calcium channel is not the ion channel delivering the Ca2+. We propose a model whereby Ca2+ influx, potentially through stretch activated channels, is sufficient to activate calpain 2 at the trailing edge of a migrating T cell and this activity is essential for the turnover of LFA-1 adhesions.


Conflict of interest statement

Competing Interests: The authors have declared that no competing interests exist.

Figures

Figure 1
Figure 1. Calpain regulation of T cell migration.
(A) T lymphoblasts were allowed to migrate for 15 min on ICAM-1 in the presence or absence of calpain inhibitor, calpeptin, before fixation. Total LFA-1 was detected using anti-LFA-1 mAb 38 and F-actin with fluorescently-labelled phalloidin. Panels are composite images of Z sections through the cells starting from the interface with ICAM-1. LFA-1 mAb (green), F-actin (red). Inset: higher magnification view of the LFA-1 trails shows distinct clusters of integrin. Scale bar = 10 µm. Images are representative of n = 4 experiments; (B) The calpain inhibitor, calpeptin, reduces the speed of migration on the LFA-1 ligand ICAM-1. For untreated and calpeptin-treated T cells, the speed was calculated for 20 cells over a 15 min period, n = 4; (C) Calpain regulation of T cell migration. Individual T cells display random migration when observed for 15 min with reduced migration following calpeptin treatment (50 µg/ml) (n = 20 T cells/experiment, n = 3 experiments); (D) Detail of LFA-1 clusters detected with mAb 24 in trails of calpain-inhibited migrating T cells after 45 min. The panel is a composite image of Z sections through the T cells. LFA-1 mAb 24 (green), F-actin (red), Scale bar = 10 µm. Images are representative of n = 4 experiments.
Figure 2
Figure 2. The effect of calpain inhibition and location of active calpain in T cells.
(A) Effect of calpain inhibition on T cell morphology. The proportion of untreated and calpeptin-treated T cells with a detached uropod (n = 50 per data set). Representative images of untreated and calpeptin-treated T cells are shown with the uropod and trailing edge respectively indicated by a white asterisk. *P<0.05; (B) Effect of calpain block on distribution of LFA-1 and morphology of migrating T cells over time (seconds). T cells were labelled with Alexa488 conjugated-Fab' fragments of a non-function affecting anti-LFA-1 mAb YTH81.5 (green), then allowed to migrate on ICAM-1-coated substrate ± calpeptin. Images are representative of n = 4 experiments; (C) Distribution of active calpain in T cells loaded with calpain substrate CMAC,t-BOC-Leu-Met and adhered to ICAM-1 ± calpeptin. Z section images were taken through migrating cells at 2 µm intervals from the level of T cell/ICAM-1 interface. Pseudo-color glow scale (red, highest to blue, lowest activity). Scale bar = 10 µm, images are representative of n = 4 experiments.
Figure 3
Figure 3. Effect of Ca2+ channel inhibitors on calpain activity and T cell migration.
Effect of ion channel inhibitors 2-APB (50 µM), SKF-96365 (100 µM), LaCl3 (2 mM) on the following (A–D): (A) Calpain activity as detected by expression of calpain substrate CMAC,t-BOC-Leu-Met. Pseudo-color glow scale (red, highest to blue, lowest activity). Outline of DIC image shown as a white tracing. Scale bar = 10 µm. Images are representative of n = 4 experiments; (B) Individual T cells show random migration following observation for 20 min (n = 15 cells, n = 3 experiments); (C) Overall speed of T cell migration (n = 15 cells). *** P<0.001; (D) Cell length of migrating cells, n = 25 cells. *** P<0.001; (E) Ca2+ levels observed in T cells polarized on ICAM-1 before and after treatment with 2-APB. Panels show Z sections from the level of the ICAM-1/T cell interface up through the cell at 2 µm intervals. Pseudo-colour glow scale (red, highest to blue, lowest activity). Scale bar = 10 µm; images are representative of n = 3 experiments.
Figure 4
Figure 4. Investigation of ORAI1 mutant T cell calpain activity and migration.
(A) Morphology of control and ORAI1 mutant T cell lines migrating on ICAM-1. White arrow indicates the leading edge of the T cell; n = 3 complete sets of experiments for each cell line; (B) Overall speed of migration (n = 12 T cells); (C) Calpain activity of individual control and ORAI1 mutant T cell lines as detected by expression of calpain substrate CMAC,t-BOC-Leu-Met. Pseudo-color glow scale (red, highest to blue, lowest activity). Outline of DIC image shown as a white tracing. Scale bar = 10 µm; (D) Proportion of total T cells expressing CMAC activity (n = 15 cells).
Figure 5
Figure 5. Calpain activity at the rear of the T cell is due to calpain 2.
(A) Immunofluorescent staining of fixed T cells migrating on ICAM-1. The images are composites of Z sections taken through the cell. Calpain mAbs = green; F-actin = red. Scale bar = 10 µm; images are representative of n = 3 experiments; (B) Western blotting of the HSB2 T cell lysates following calpain 1 and 2 siRNA knockdown, α-tubulin represents loading control; n = 4 experiments; (C) Calpain activity in the HSB2 T cells following calpain 1 and 2 siRNA knockdown as detected by expression of calpain substrate CMAC,t-BOC-Leu-Met; pseudo-color glow scale (red, highest to blue, lowest activity). Scale bar = 10 µm; (D) Quantification of HSB2 cells displaying calpain activity following siRNA knockdown of calpain 1 or 2, n = 2–5 experiments, *P<0.05; (E) Individual T cells displaying random migration observed for 20 min and (F) quantification of overall speed of migration (n = 15 cells, representative of n = 3 experiments), *** P<0.001.

References

    1. Dustin ML. Stop and go traffic to tune T cell responses. Immunity. 2004;21:305–314. - PubMed
    1. Evans R, Patzak I, Svensson L, De Filippo K, Jones K, et al. Integrins in immunity. J Cell Sci. 2009;122:215–225. - PubMed
    1. Smith A, Carrasco YR, Stanley P, Kieffer N, Batista FD, et al. A talin-dependent LFA-1 focal zone is formed by rapidly migrating T lymphocytes. J Cell Biol. 2005;170:141–151. - PMC - PubMed
    1. Stanley P, Smith A, McDowall A, Nicol A, Zicha D, et al. Intermediate-affinity LFA-1 binds alpha-actinin-1 to control migration at the leading edge of the T cell. EMBO J. 2008;27:62–75. - PMC - PubMed
    1. Glading A, Lauffenburger DA, Wells A. Cutting to the chase: calpain proteases in cell motility. Trends Cell Biol. 2002;12:46–54. - PubMed

Publication types

MeSH terms