. 2010 Nov 30;5(11):e15128.
doi: 10.1371/journal.pone.0015128.

The mitotic arrest deficient protein MAD2B interacts with the clathrin light chain A during mitosis

Affiliations

The mitotic arrest deficient protein MAD2B interacts with the clathrin light chain A during mitosis

Klaas Medendorp et al. PLoS One. .

Abstract

Background: Although the mitotic arrest deficient protein MAD2B (MAD2L2) is thought to inhibit the anaphase promoting complex (APC) by binding to CDC20 and/or CDH1 (FZR1), its exact role in cell cycle control still remains to be established.

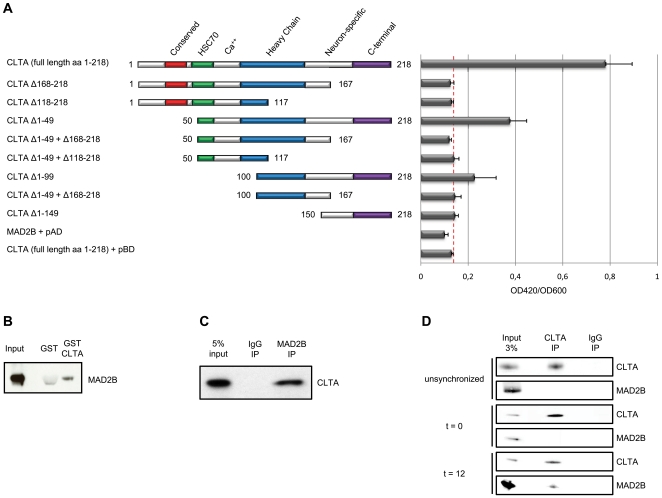
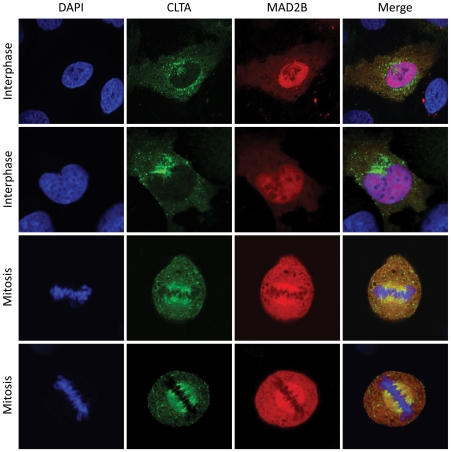
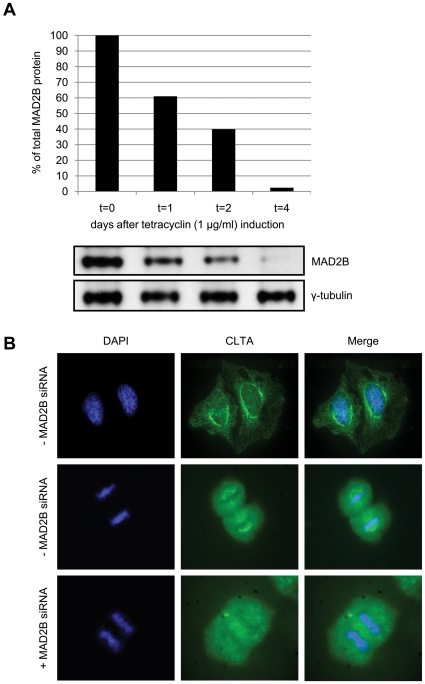
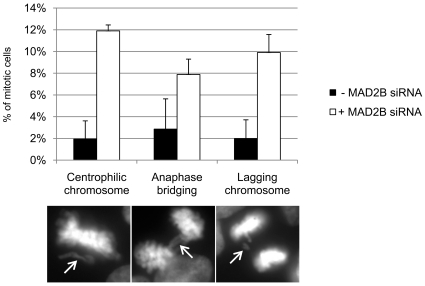
Methodology/principal findings: Using a yeast two-hybrid interaction trap we identified the human clathrin light chain A (CLTA) as a novel MAD2B binding protein. A direct interaction was established in mammalian cells via GST pull-down and endogenous co-immunoprecipitation during the G2/M phase of the cell cycle. Through subsequent confocal laser scanning microscopy we found that MAD2B and CLTA co-localize at the mitotic spindle. Clathrin forms a trimeric structure, i.e., the clathrin triskelion, consisting of three heavy chains (CLTC), each with an associated light chain. This clathrin structure has previously been shown to be required for the function of the mitotic spindle through stabilization of kinetochore fibers. Upon siRNA-mediated MAD2B depletion, we found that CLTA was no longer concentrated at the mitotic spindle but, instead, diffusely distributed throughout the cell. In addition, we found a marked increase in the percentage of misaligned chromosomes.

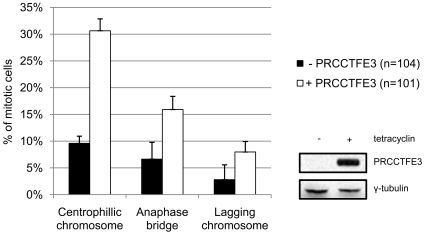
Conclusions/significance: Previously, we identified MAD2B as an interactor of the renal cell carcinoma (RCC)-associated protein PRCC. In addition, we found that fusion of PRCC with the transcription factor TFE3 in t(X;1)(p11;q21)-positive RCCs results in an impairment of this interaction and a concomitant failure to shuttle MAD2B to the nucleus. Our current data show that MAD2B interacts with CLTA during the G2/M phase of the cell cycle and that depletion of MAD2B leads to a marked increase in the percentage of misaligned chromosomes and a redistribution of CLTA during mitosis.


Conflict of interest statement

Competing Interests: The authors have declared that no competing interests exist.

Figures

Figure 1
Figure 1. MAD2B and CLTA interact physically.
(A) Schematic representation of the CLTA (deletion) constructs (numbers correspond to amino acid positions) and corresponding interactions with MAD2B measured as OD420/OD600 ratios using a liquid β-galactosidase assay. (B) HA-MAD2B protein was probed for interaction with either GST or GST-CLTA. Subsequent western blot analysis was performed using an anti-HA tag antibody. (C) U2OS cells were transiently transfected with HA-MAD2B and FLAG-CLTA. Immunoprecipitations (IP) were performed with a control rabbit antibody (IgG) and an anti-MAD2B antibody as indicated. Western blot analysis was performed using an anti-FLAG antibody. (D) U2OS cells were synchronized by a double thymidine block (see Materials and methods) and subsequently harvested at different time intervals after release from this cell cycle block. Immunoprecipitations were performed on cell lysates from unsynchronized cells and from cells at t = 0 and t = 12 after release. Endogenous proteins were precipitated with an anti-CLTA and a control mouse antibody (IgG) as indicated. Western blot analysis was performed using anti-CLTA and anti-MAD2B antibodies.
Figure 2
Figure 2. MAD2B and CLTA co-localize at the mitotic spindle.
Cells were transiently transfected with CLTA-GFP (green) and MAD2B-mRFP (red) constructs. DAPI staining (blue) marks the position of the nuclei and chromosomes. Yellow staining in the overlay indicates co-localization of MAD2B and CLTA. The upper two panels show cells in interphase, the lower two panels show cells in mitosis.
Figure 3
Figure 3. Cellular re-distribution of CLTA after MAD2B knockdown.
(A) HEK293/T-REx cells were stably transfected with a pSUPERIOR-MAD2B siRNA construct (see Materials and methods). Subsequently, tetracyclin was added and cells were collected after 0, 1, 2 and 4 days, lysed and subjected to western blot analysis using anti-MAD2B and anti-γ-tubulin (control) antibodies. (B) HEK293/T-REx/pSUPERIOR-MAD2B cells were grown with or without tetracyclin (+/− MAD2B siRNA, respectively). Endogenous CLTA proteins were detected using an anti-CLTA antibody (green). DAPI staining (blue) was used to mark nuclei and chromosomes. In the presence of MAD2B CLTA localizes to mitotic spindles during mitosis, whereas after MAD2B depletion CLTA is re-distributed throughout the cell.
Figure 4
Figure 4. MAD2B depletion leads to mitotic defects.
HEK293/T-REx/pSUPERIOR-MAD2B cells were transiently transfected with a H2B-RFP construct (see Materials and methods) and grown with or without tetracyclin (+/− MAD2B siRNA), respectively. Subsequently, mitotic cells were scored for misaligned chromosomes. Percentages of cells with misalignments, such as centrophilic chromosomes, anaphase bridges and lagging chromosomes, are shown in the histogram. Black bars represent cells normally expressing MAD2B (- MAD2B siRNA; see Fig. 3, t = 0), and white bars represent MAD2B depleted cells (+MAD2B siRNA; see Fig. 3, t = 4). In the lower panels examples of centrophilic chromosomes, anaphase bridges and lagging chromosomes are shown (arrows).
Figure 5
Figure 5. PRCCTFE3 expression leads to mitotic defects.
HEK293/T-REx/PRCCTFE3 cells were transiently transfected with a H2B-RFP construct (see Materials and methods) and grown with or without tetracyclin (+/− PRCCTFE3), respectively. Subsequently, mitotic cells were scored for misaligned chromosomes. Percentages of cells with misalignments, such as centrophilic chromosomes, anaphase bridges and lagging chromosomes, are shown in the histogram. Black bars represent un-induced cells (- PRCCTFE3), and white bars represent induced cells (+PRCCTFE3). In the right panel, PRCCTFE3 protein expression in the induced (+ tetracyclin) cells is shown.

Similar articles

Cited by

References

    1. Cahill DP, da Costa LT, Carson-Walter EB, Kinzler KW, Vogelstein B, et al. Characterization of MAD2B and other mitotic spindle checkpoint genes. Genomics. 1999;58:181–187. - PubMed
    1. van den Hurk WH, Martens GJ, Geurts van Kessel A, van Groningen JJM. Isolation and characterization of the Xenopus laevis orthologs of the human papillary renal cell carcinoma-associated genes PRCC and MAD2L2 (MAD2B). Cytogenet Genome Res. 2004;106:68–73. - PubMed
    1. Chen J, Fang G. MAD2B is an inhibitor of the anaphase-promoting complex. Genes Dev. 2001;15:1765–1770. - PMC - PubMed
    1. Pfleger CM, Salic A, Lee E, Kirschner MW. Inhibition of Cdh1-APC by the MAD2-related protein MAD2L2: a novel mechanism for regulating Cdh1. Genes Dev. 2001;15:1759–1764. - PMC - PubMed
    1. Royle SJ, Bright NA, Lagnado L. Clathrin is required for the function of the mitotic spindle. Nature. 2005;434:1152–1157. - PMC - PubMed

Publication types

MeSH terms