

doi: 10.1016/j.nantod.2009.12.001.
Microfluidic tools for cell biological research
Affiliations
- PMID: 21152269
- PMCID: PMC2998071
- DOI: 10.1016/j.nantod.2009.12.001
Item in Clipboard
Microfluidic tools for cell biological research
Nano Today.
2010 Feb.
Abstract
Microfluidic technology is creating powerful tools for cell biologists to control the complete cellular microenvironment, leading to new questions and new discoveries. We review here the basic concepts and methodologies in designing microfluidic devices, and their diverse cell biological applications.
Figures
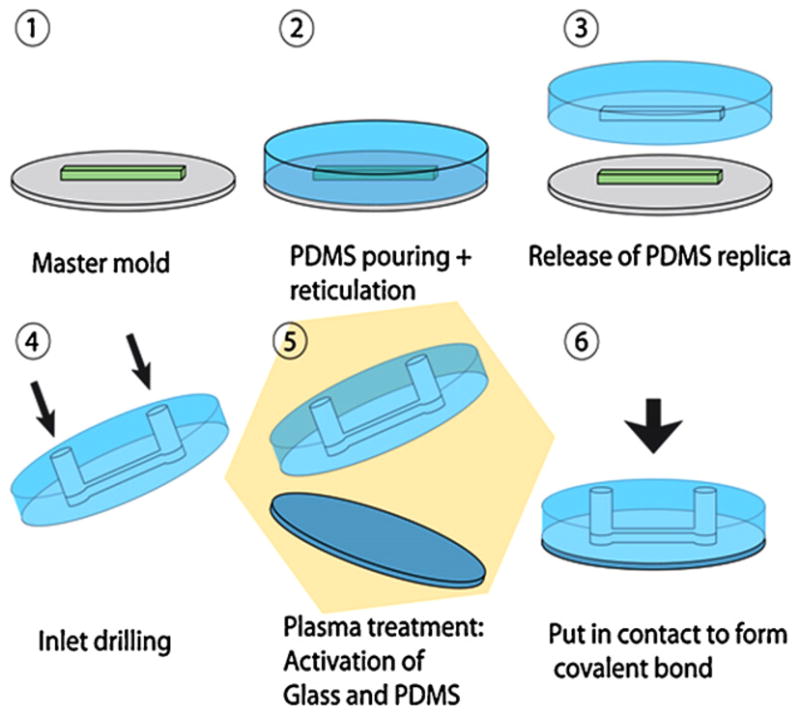
Fabrication procedure for a single layer microfluidic device. See text for details.
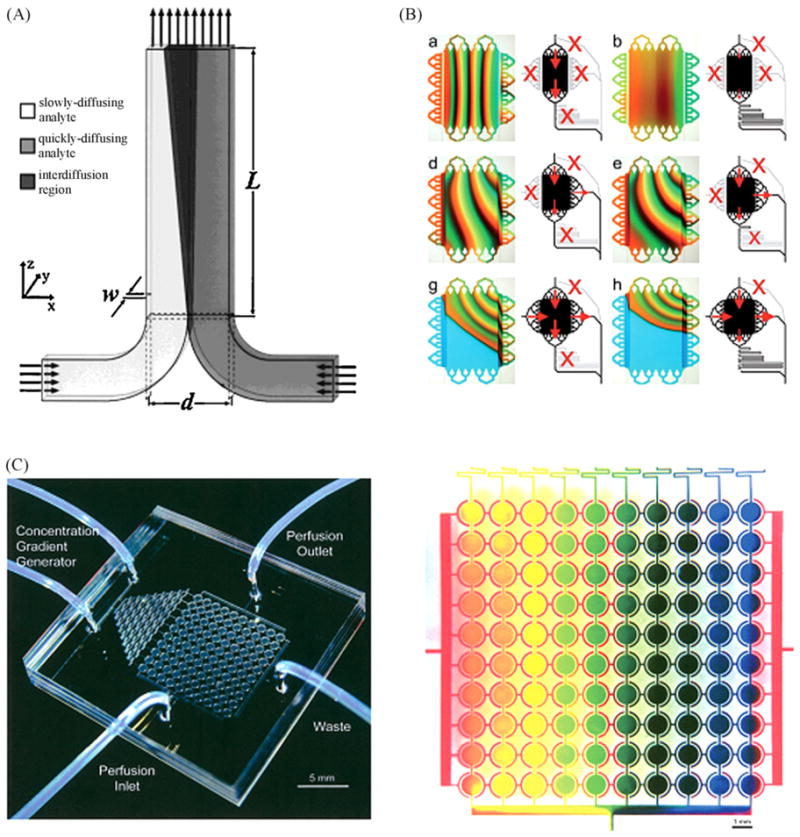
Microfluidic gradient generator. (A) Schematic representation of a T-sensor with two inputs. One can see the diffusion between the two laminar streams along the device [24]. (B) μGG composed of an array of 16 multiplexed inlets which allow 64 combinations of gradient generation. This figure shows gradient shape modification in the central chamber depending of valve state [28]. (C) A microfluidic cell culture array containing 100 cell culture chambers with integrated gradient generators [162]. (D) Zoom on the cell culture array with gradient generation demonstrated using red, blue and yellow dye [162].
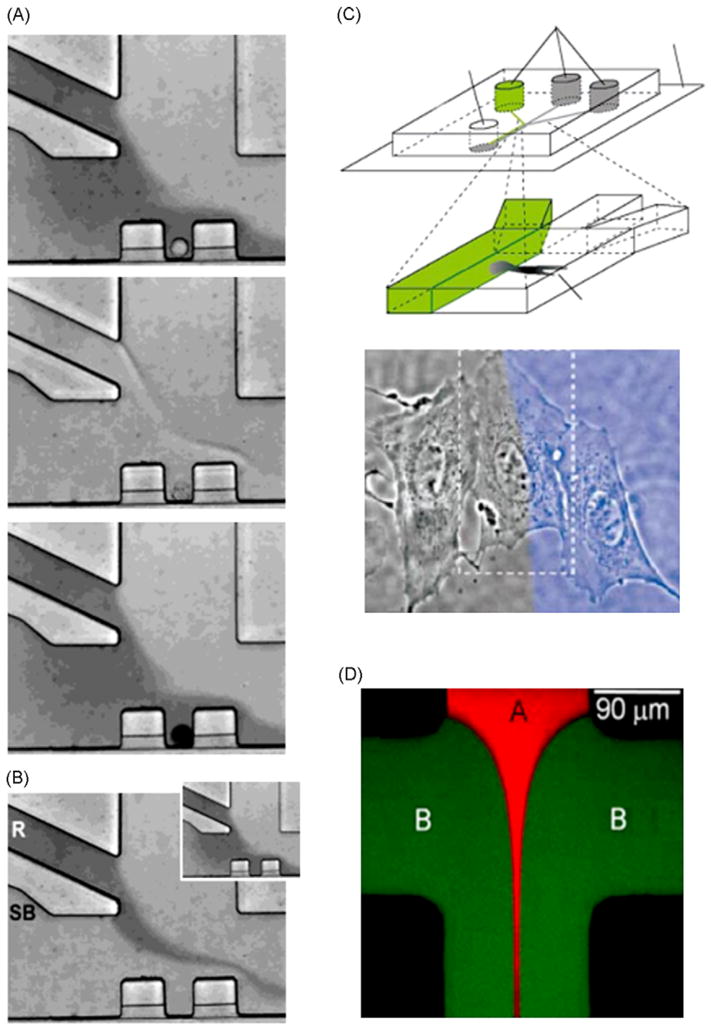
Spatiotemporal drug control. (A) Picture from 2 min movie showing successive perfusion with Trypan blue dye on live cell, and subsequent methanol and Trypan after cell death. (B) Picture showing the ability to change the stream in contact with a cell by changing inlet flow rate. This type of medium switching can be done in 130 ms [37]. (C) Schematic of PARTCELL principle [36]. Using laminar flow properties one is able to partially treat a cell. Picture shows treatment of a portion of a single cell with Latrunculin A and blue dye. (D) Picture showing hydrodynamic focusing. Flows B (green) arriving from both sides of flow A (red) focused and maintained flow in a fine stream configuration [40].
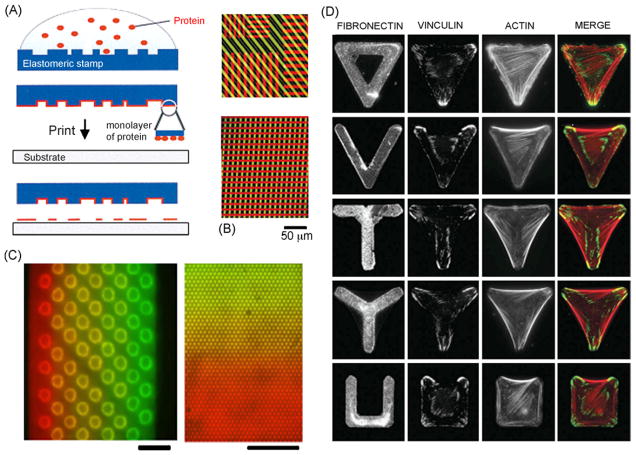
Substrate patterning using microcontact printing (μCP). (A) Schematic of μCP procedure [58]. (B) Bicolor μCP using successive stamping of molecules [58]. (C) Multicolor μCP using stamp pre-inked with molecular gradient [62]. (D) Influence of adhesive micropattern on cell cytoskeleton. This figure show vinculin and actin repartition for different fibronectin patterns [50].
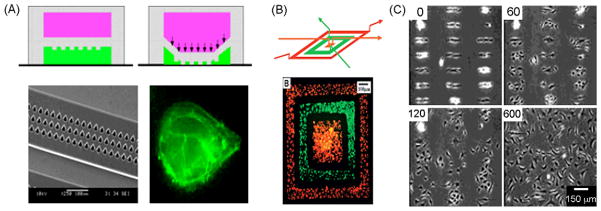
Substrate patterning using flow or active elements. (A) Structured valve based microfluidic device for substrate patterning. A1—A2: schematics showing cross-sectional view of the device and deformation of structured membrane when applying a pressure on the top channel. Flow of passive agent recovers only the area unprotected by membrane structure, allowing future adhesion of ECM protein. A3: picture shows a scanning electron micrograph of the membrane structure. A4: fluorescence picture of actin stained endothelial cell following ECM matrix protein shape [71]. (B) Direct cell patterning using reversible device with two interconnected channel layers. Up: schematic representation of the method used to pattern different cell types on the same substrate. Down: fluorescence picture of two cell types deposited on a tissue culture dish in a concentric pattern using this device [72]. (C) Dynamic cell patterning. Picture showing BCE cells attached to a surface patterned with specific thiols. Application of a cathode voltage pulse allowed release of the cells from the micropattern (time in minutes) [79].
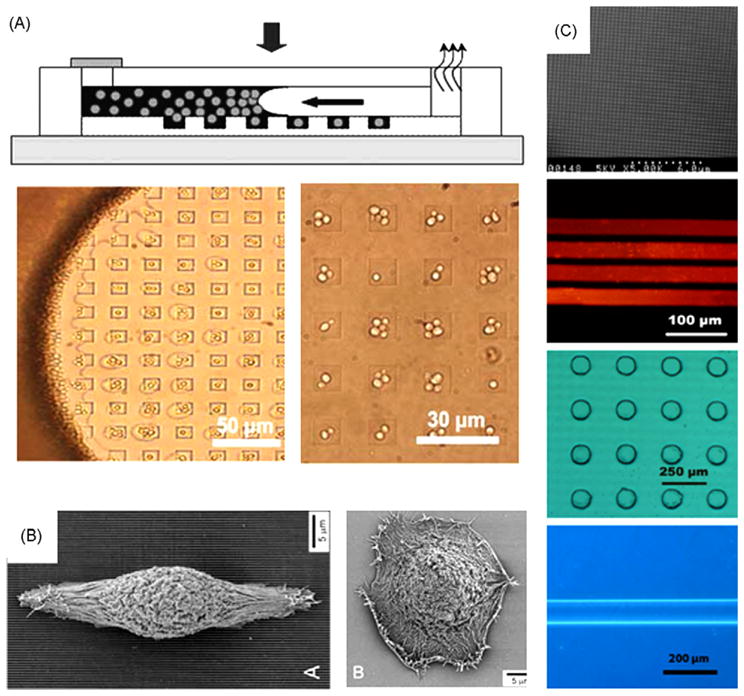
Substrate physical patterning. (A) Top: schematic of cell docking in microwells using capillary force. Down: picture of SG3 yeast docking in microwells [83]. (B) Cell guidance using physically modified substrate. Left: picture of corneal epithelial cells on SiO2 substrate with 70 nm wide ridges. Right: cell on a smooth SiO2 substrate [91]. (C) Example of pattern made by micromolding technique. From top to bottom: 150 nm diameter pillar, fluorescent image of 40 μm stripe of quantum dot, 100 μm hole in a 20 μm thick PDMS layer, optical image of 100 μm width and 20 μm height wall of agar gel [84].
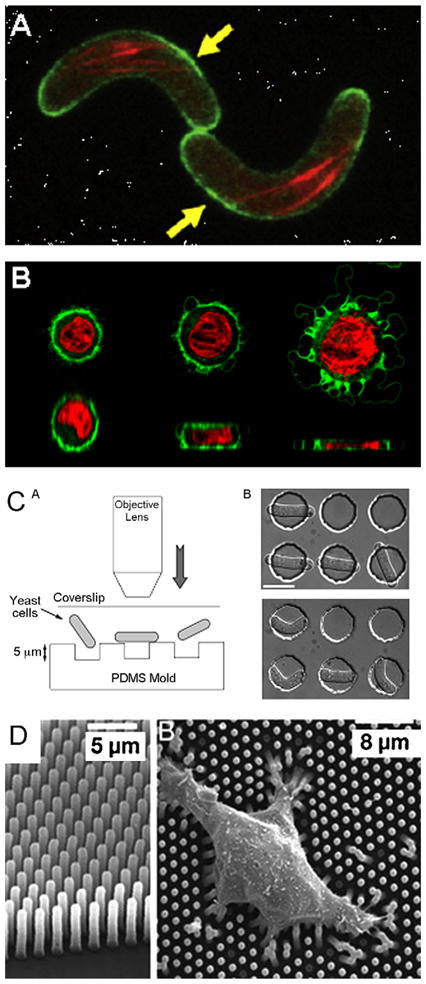
Applying and measuring forces on cell using microdevices. (A) Constraining cells using microchannel: picture of rod-shaped fission yeast cells in curved microchannel. Cells have to bend to conform to the channel shape [94]. (B) Using microfabricated membrane to deform cell: 3D reconstruction of confocal picture of a cell squeezed by a pressurized PDMS membrane. Increase in membrane pressure lead to cell deformation and cell blebbing. Top: horizontal cross-section, bottom: vertical cross-section (red: nucleus, green: membrane). (C) Microfabricated chambers for cell constrain. Left: schematic of the system showing how yeast cells are placed into the PDMS chambers using the pushing forces of the objective lens. Right: picture of the cell before (unconstrained) and after entering the microchamber (constrained) [102]. This kind of device can also be used for cell mechanical properties measurement using the deformation of the PDMS chamber due to cell turgor pressure [103]. (D) Measuring force using micropillars array: scanning EM picture of micropillars array allowing cell force measurement using pillars deformation [82].
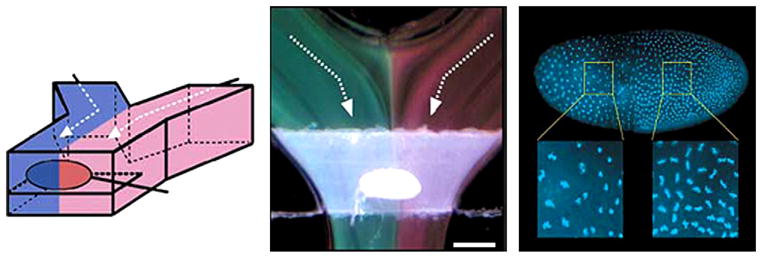
Integrated temperature control. Temperature step generator. Left: schematic of PDMS microfluidic device generating a temperature step around a Drosophila embryo. Middle: visualization of the temperature step with thermochromic liquid crystal (green: 21 °C—–red: 28 °C). Right: influence of the temperature step on the embryo nuclear density after 150 min [126].
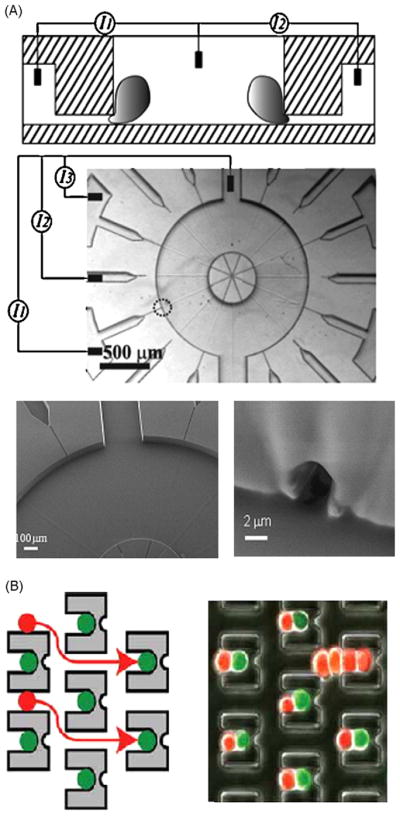
Patch clamp and cell fusion. (A) PDMS micro patch clamp. Top: schematic of the patch clamp device. Middle: picture of the patch clamp array. The small circle indicates one of the patch sites. Bottom: zoom on the patch site [149]. (B) Cell pairing and fusion device: schematic and picture show two different cell types pairing before fusion [148].
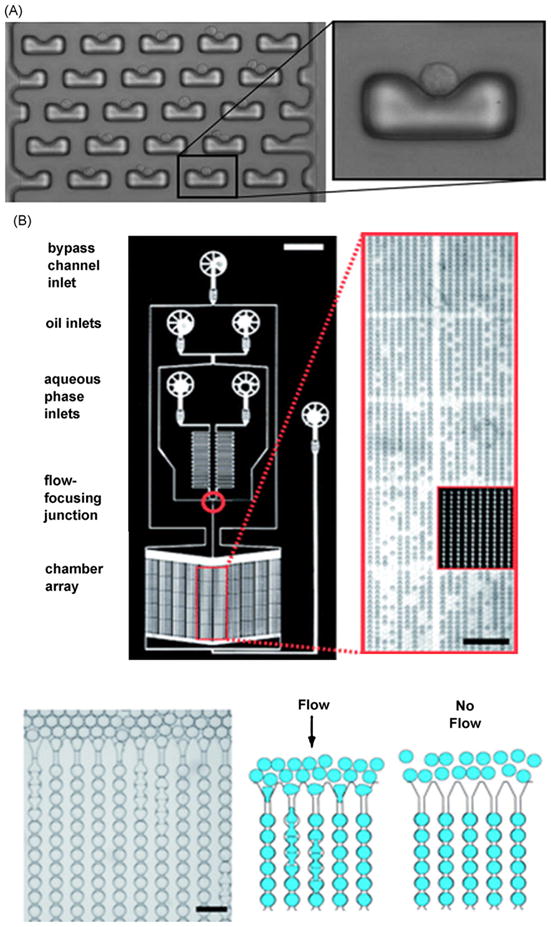
Integrated cell culture system. (A) Single cell trapping array. Picture of a cell trapping array using hydrodynamic trap and zoom on a single cell trap [168]. (B) Droplet based yeast culture system. Top: this device can generate and store 8000 droplets within a 7 mm2 area. Bottom: picture and schematic illustrating droplet loading (scale 100 μm) [177].
References
-
- Campbell CJ, Grzybowski BA. Philos Trans A Math Phys Eng Sci. 2004;362:1069. - PubMed
-
- Stroock AD, Dertinger SK, Ajdari A, Mezic I, Stone HA, Whitesides GM. Science. 2002;295:647. - PubMed
-
- Duffy DC, McDonald JC, Schueller OJA, Whitesides GM. Anal Chem. 1998;70:4974. - PubMed
-
- McDonald JC, Whitesides GM. Acc Chem Res. 2002;35:491. - PubMed
-
- Unger MA, Chou HP, Thorsen T, Scherer A, Quake SR. Science. 2000;288:113. - PubMed
Grants and funding
LinkOut - more resources
Full Text Sources
Other Literature Sources