. 2010 Oct 19;11(10):4014-34.
doi: 10.3390/ijms11104014.

Stability and folding behavior analysis of zinc-finger using simple models

Affiliations

Stability and folding behavior analysis of zinc-finger using simple models

Shan Chang et al. Int J Mol Sci. .

Abstract

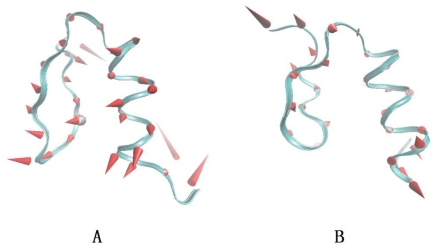
Zinc-fingers play crucial roles in regulating gene expression and mediating protein-protein interactions. In this article, two different proteins (Sp1f2 and FSD-1) are investigated using the Gaussian network model and anisotropy elastic network model. By using these simple coarse-grained methods, we analyze the structural stabilization and establish the unfolding pathway of the two different proteins, in good agreement with related experimental and molecular dynamics simulation data. From the analysis, it is also found that the folding process of the zinc-finger motif is predominated by several factors. Both the zinc ion and C-terminal loop affect the folding pathway of the zinc-finger motif. Knowledge about the stability and folding behavior of zinc-fingers may help in understanding the folding mechanisms of the zinc-finger motif and in designing new zinc-fingers. Meanwhile, these simple coarse-grained analyses can be used as a general and quick method for mechanistic studies of metalloproteins.

Keywords: FSD-1; Gaussian network model; Sp1f2; anisotropy elastic network model; folding pathway; zinc finger.


Figures

Figure 1
Figure 1
(A) Ribbon representation of the main-chain fold of Sp1f2 (PDB code: 1sp2); (B) Ribbon representation of the main-chain fold of FSD-1 (PDB code: 1fsd).
Figure 2
Figure 2
Experimental (light line) and calculated (dark line) B-factors of Sp1f2.
Figure 3
Figure 3
The fastest five mode shapes of the Sp1f2. There are several peaks marked in the curve that correspond to the kinetically key residues.
Figure 4
Figure 4
(A) The slowest mode shapes of Sp1f2 with zinc binding; (B) The slowest mode shapes of Sp1f2 without zinc binding.
Figure 5
Figure 5
The contact maps of the native conformation (A), of the conformations with the LNNC to be 20 (B), 30 (C), 48 (D), 60 (E) and 72 (F) for Sp1f2, respectively. Each native contact is marked by the symbol * in the maps.
Figure 6
Figure 6
The contact maps of the native conformation (A), of the conformations with the LNNC to be 20 (B), 30 (C) and 50 (D) for FSD-1, respectively. Each native contact is marked by the symbol * in the maps.
Figure 7
Figure 7
The contact maps of the native conformation (A), of the conformations with the LNNC to be 20 (B), 30 (C), 48 (D), 60 (E) and 72 (F) for Sp1f2 without zinc binding, respectively. Each native contact is marked by the symbol * in the maps.
Figure 8
Figure 8
The cross-correlation maps calculated using all modes for native conformation (A) and several conformations with LNNC to be 20 (B), 30 (C), 48 (D), 60 (E) and 72 (F) during the unfolding process of Sp1f2. As shown in the bar on the right, the dark regions in the figure indicate negative correlation and the light regions present positive correlation. Both the x and y axes of the maps are residue indices.
Figure 9
Figure 9
The cross-correlation maps for native conformation (A) and several conformations with LNNC to be 20 (B), 30 (C) and 50 (D) during the unfolding process of FSD-1. As shown in the bar on the right, the dark regions in the figure indicate negative correlation and the light regions present positive correlation. Both the x and y axes of the maps are residue indices.
Figure 10
Figure 10
The cross-correlation maps for native conformation (A) and several conformations with LNNC to be 20 (B), 30 (C), 48 (D), 60 (E) and 72 (F) during the unfolding process of Sp1f2 without zinc binding. As shown in the bar on the right, the dark regions in the figure indicate negative correlation and the light regions present positive correlation. Both the x and y axes of the maps are residue indices.
Figure 11
Figure 11
The first slowest motive mode sketch maps of the Sp1f2 (A) and FSD-1 (B). The first slow motive modes are shown with the cone model. The length of cone is correlative with the motive magnitude and the motive direction is depicted with the orientation of cone.

Similar articles

Cited by

References

    1. Zhang Y. Protein structure prediction: When is it useful? Curr. Opin. Struct. Biol. 2009;19:145–155. - PMC - PubMed
    1. Zhang J, Li WF, Wang J, Qin M, Wu L, Yan ZQ, Xu WX, Zuo GH, Wang W. Protein folding simulations: from coarse-grained model to all-atom model. IUBMB Life. 2009;61:627–643. - PubMed
    1. Chen YW, Ding F, Nie HF, Serohijos AW, Sharma S, Wilcox KC, Yin SY, Dokholyan NV. Protein folding: then and now. Arch. Biochem. Biophys. 2008;469:4–19. - PMC - PubMed
    1. Gruebele M. Protein folding: the free energy surface. Curr. Opin. Struct. Biol. 2002;12:161–168. - PubMed
    1. Alexandrescu AT. Amyloid accomplices and enforcers. Protein Sci. 2005;14:1–12. - PMC - PubMed

Publication types

LinkOut - more resources