. 2008 Mar 1;1(1):84-92.
doi: 10.1007/s12195-008-0008-8.

Model for Protein Concentration Gradients in the Cytoplasm

Affiliations

Model for Protein Concentration Gradients in the Cytoplasm

Karen Lipkow et al. Cell Mol Bioeng. .

Abstract

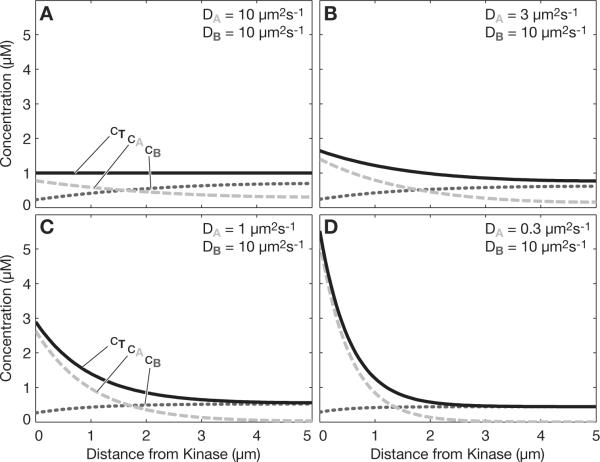
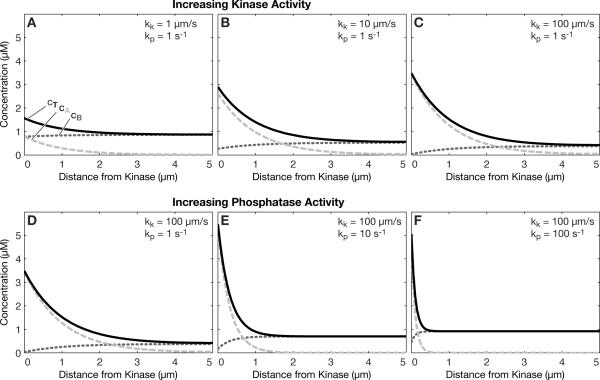
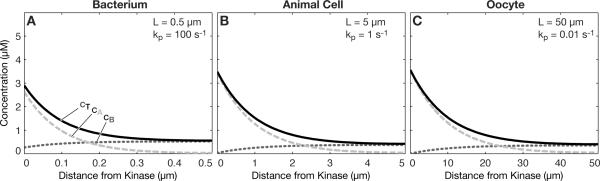
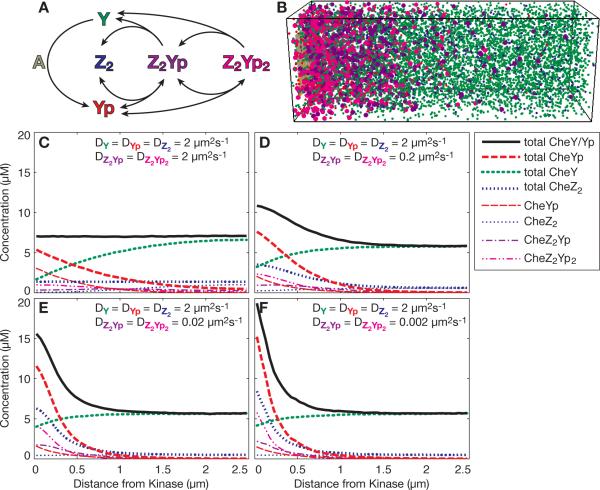
Intracellular protein concentration gradients are generally thought to be unsustainable at steady-state due to diffusion. Here we show how protein concentration gradients can theoretically be sustained indefinitely through a relatively simple mechanism that couples diffusion to a spatially segregated kinase-phosphatase system. Although it is appreciated that such systems can theoretically give rise to phosphostate gradients, it has been assumed that they do not give rise to gradients in the total protein concentration. Here we show that this assumption does not hold if the two forms of protein have different diffusion coefficients. If, for example, the phosphorylated state binds selectively to a second larger protein or protein complex then a steady state gradient in total protein concentration will be created. We illustrate the principle with an analytical solution to the diffusion-reaction problem and by stochastic individual-based simulations using the Smoldyn program. We argue that protein gradients created in this way need to be considered in experiments using fluorescent probes and could in principle encode spatial information in the cytoplasm.


Figures

Fig. 1
Fig. 1
Total protein gradient. (a) When the diffusion coefficients of the phosphorylated form and the dephosphorylated form are equal (DA=DB), then a kinase at the left boundary and a phosphatase uniformly distributed in the cytoplasm will establish a phosphostate gradient (dashed light gray = phosphorylated, dotted dark gray = dephosphorylated), as previously noted, but no gradient in the total protein concentration (black). (b) When the diffusion coefficients of the two forms differ (DA≠DB), then there will be a gradient in not only the phosphostate, but also the total protein concentration. (c) and (d) Further disparity in the diffusion coefficients further increases the total protein concentration gradient. Kinase rate constant kk=10 μm/s, phosphatase rate constant kp=1 s−1, overall protein concentration 1 μM in all panels.
Fig. 2
Fig. 2
Effect of kinase and phosphatase rate constants on the total protein concentration gradient. (a–c) The total protein concentration gradient increases with increasing kinase rate constant, kk. (d–f) The total protein concentration gradient also increases, and decays over a shorter distance with increasing phosphatase rate constant, kp. Diffusion coefficients DA=1 μm2s−1, DB=10 μm2s−1, overall protein concentration 1 μM in all panels.
Fig. 3
Fig. 3
Total protein gradients could act across a range of cell sizes. (a) At a very high phosphatase rate (kp=100 s−1), the gradient is predicted to be appreciable in cells as small as a bacterium. (b) Animal cells and (c) oocytes/embryos can experience total protein gradients, simply by reducing the phosphatase rate constant, kp, according to the cell dimension. Diffusion coefficients DA=1 μm2s−1, DB=10 μm2s−1, kinase rate constant kk=100 μm/s, overall protein concentration 1 μM in all panels.
Fig. 4
Fig. 4
Total protein gradients in the bacterial chemotaxis signaling pathway. (a) Schematic of the relevant reactions modeled. CheY (Y) is phosphorylated by the kinase CheA (A). Up to two CheY-phosphates (Yp) can bind sequentially and reversibly to the dimeric phosphatase CheZ (Z2). Upon hydrolysis, unphosphorylated CheY is released. The phosphorylation reaction at CheA consists of several reactions. For details and all rate constants, see Table 1. (b) Snapshot of a Smoldyn simulation at steady state; diffusion coefficients as in (d). On the left is a fixed array of CheA kinases, all other molecules are diffusing freely. Colors as in (a). Monomers and dimers are shown as small spheres, all larger complexes as large spheres. (c–f) Results of stochastic simulations with Smoldyn. Means of 1000 timepoints.

References

    1. Andrews SS, Bray D. Stochastic simulation of chemical reactions with spatial resolution and single molecule detail. Phys Biol. 2004;1:137–51. - PubMed
    1. Blat Y, Eisenbach M. Phosphorylation-dependent binding of the chemotaxis signal molecule CheY to its phosphatase, CheZ. Biochemistry. 1994;33(4):902–6. - PubMed
    1. Brown GC, Kholodenko BN. Spatial gradients of cellular phospho-proteins. FEBS Lett. 1999;457(3):452–4. - PubMed
    1. Cassimeris L. The oncoprotein 18/stathmin family of microtubule destabilizers. Curr Opin Cell Biol. 2002;14(1):18–24. - PubMed
    1. Caudron M, Bunt G, Bastiaens P, Karsenti E. Spatial coordination of spindle assembly by chromosome-mediated signaling gradients. Science. 2005;309(5739):1373–6. - PubMed

LinkOut - more resources