. 2010 Nov 30;5(11):e14129.
doi: 10.1371/journal.pone.0014129.

Spike avalanches exhibit universal dynamics across the sleep-wake cycle

Affiliations

Spike avalanches exhibit universal dynamics across the sleep-wake cycle

Tiago L Ribeiro et al. PLoS One. .

Abstract

Background: Scale-invariant neuronal avalanches have been observed in cell cultures and slices as well as anesthetized and awake brains, suggesting that the brain operates near criticality, i.e. within a narrow margin between avalanche propagation and extinction. In theory, criticality provides many desirable features for the behaving brain, optimizing computational capabilities, information transmission, sensitivity to sensory stimuli and size of memory repertoires. However, a thorough characterization of neuronal avalanches in freely-behaving (FB) animals is still missing, thus raising doubts about their relevance for brain function.

Methodology/principal findings: To address this issue, we employed chronically implanted multielectrode arrays (MEA) to record avalanches of action potentials (spikes) from the cerebral cortex and hippocampus of 14 rats, as they spontaneously traversed the wake-sleep cycle, explored novel objects or were subjected to anesthesia (AN). We then modeled spike avalanches to evaluate the impact of sparse MEA sampling on their statistics. We found that the size distribution of spike avalanches are well fit by lognormal distributions in FB animals, and by truncated power laws in the AN group. FB data surrogation markedly decreases the tail of the distribution, i.e. spike shuffling destroys the largest avalanches. The FB data are also characterized by multiple key features compatible with criticality in the temporal domain, such as 1/f spectra and long-term correlations as measured by detrended fluctuation analysis. These signatures are very stable across waking, slow-wave sleep and rapid-eye-movement sleep, but collapse during anesthesia. Likewise, waiting time distributions obey a single scaling function during all natural behavioral states, but not during anesthesia. Results are equivalent for neuronal ensembles recorded from visual and tactile areas of the cerebral cortex, as well as the hippocampus.

Conclusions/significance: Altogether, the data provide a comprehensive link between behavior and brain criticality, revealing a unique scale-invariant regime of spike avalanches across all major behaviors.


Conflict of interest statement

Competing Interests: The authors have declared that no competing interests exist.

Figures

Figure 1
Figure 1. Obtaining spike avalanches from raw data.
(a) Raster plot of neuronal spikes and LFPs traces recorded from a freely-behaving rat undergoing the three major behavioral states (first three panels, 2 s windows) or anesthesia (last panel, 3 s window). Note the clearly rhythmic spiking activity coupled with LFP oscillations during anesthesia. (b) To understand how spike avalanches were defined, consider a 40-ms excerpt sliced in 1.3-ms time bins. Adding up all spikes within each bin, one obtains a sequence of avalanches of sizes 2, 1, 2, 1, 4, 2, 4, 2, 1, and 2. To account for firing rates variations across behavioral states, experimental stages and brain structures, and to control for neuronal ensemble size, bin width corresponded to the average inter-event interval (IEI) in each dataset. (c) Time series of spike avalanche sizes in S1 cortex. Horizontal arrow shows waiting time between consecutive avalanches of minimum size sc.
Figure 2
Figure 2. Avalanche size distributions were stable across behavioral states, experimental stages and brain areas.
Avalanche size distributions. Each row represents a brain region, while columns distinguish stages of the experiment. For each combination, the three behavioral states are shown in a double logarithmic plot for data pooled from representative rats (single animal WK distributions in gray). Lines represent lognormal fits.
Figure 3
Figure 3. Size distributions from different conditions are not significantly different and deviate substantially from the surrogated data size distributions.
(a) Size distributions for original (colors) and surrogated (black) data, for three different conditions. Lines represent lognormal fits. Although surrogated spike trains have precisely the same firing rates as original data, larger avalanches consistently occur less frequently. (b) Comparison between cumulative size distributions for different cases. In gray, the QQ-plot for the same curves. P-value calculated by a KS test; note that the distributions are very similar despite failing the statistical test.
Figure 4
Figure 4. Size distributions from undersampled critical systems interpolate between lognormals and power laws.
(a) Size distributions for model (red triangles: undersampling; circles: full sampling) and FB data (blue triangles). Lines are lognormal and power law fits. Inset: model lattice (black dots) and sampled sub-lattice that mimics the configuration of the neurons recorded by the MEA (red triangles). (b) Size distributions from AN animals are well fit by power laws. Inset: size distributions for different levels of undersampling using the model modified to simulate anesthesia. (c) Size distributions from three AN rats. From bottom to top, curves go from deeply anesthetized to fully recovered (each curve corresponds to 30–60 minutes of data). Red lines represent the best fit for the bottom (power law) and top (lognormal) distributions.
Figure 5
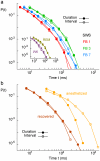
Figure 5. Avalanche duration and inter-avalanche interval distributions.
(a) Distributions for three different rats during SWS sleep. Inset: for the same rat, the same distributions for WK and REM. (b) Distributions for an animal from the AN group, during anesthesia (orange) and after recovery (brown). Note the separation of time scales between avalanche durations and inter-avalanche intervals during anesthesia.
Figure 6
Figure 6. Statistical fingerprints of criticality in spike avalanches recorded from freely-behaving animals.
(a) Power spectrum of the avalanche size time series for two FB rats and one AN rat. Though conservative, the shuffling procedure destroys the long-range correlations characterized by the 1/f spectrum seen for FB data. (b) Root-mean squared fluctuation F of the detrended avalanche size time series versus window width n, for two FB rats and one AN rat. In all cases, α denotes the exponent of a fitted power law. DFA exponents close to one are compatible with 1/f power spectrum. Note the poor quality of the power law fit for DFA AN data.
Figure 7
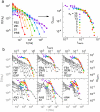
Figure 7. Waiting time distributions for different minimum avalanche sizes collapse onto a single scaling function for each FB animal (but not for AN).
(a) Probability density of avalanche recurrence times (without rescaling in the left panel; rescaled in the right panel) for one FB rat. (b) The same collapse for different animals (FB top, AN bottom). Note that the collapse under this kind of scaling occurs for all major natural behaviors, stages of the experiment and brain areas, but not during anesthesia.
Figure 8
Figure 8. Data from all FB animals have a similar scaling function, which breaks down during anesthesia.
(a) Regular and rescaled waiting time distributions for all FB rats. The scaling function is well fit by a double power law (see also Fig. 9). (b) The same distributions for AN data show no sign of collapse under the same rescaling procedure. Note the presence of a characteristic waiting time for a range of minimum avalanche sizes.
Figure 9
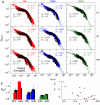
Figure 9. The scaling function is very similar across all major natural behavioral states and brain regions.
(a) Rescaled waiting time distributions obtained from all FB rats for each behavioral state and brain region (all stages of the experiment included). Colors (black) represent original (surrogated) data. The lines represent the best fit in each case. (b) Comparison between double power law (DPL) and exponentially decaying gamma (EdG) fits. The quality of the fit increases as the sum of square residuals Nred 2 decreases, showing that the DPL yields the best fit for all cases. (c) Scatter plot of the exponents of the DPL fit for all distributions in panel (a). Note that the dispersion is significantly larger for surrogated data.

References

    1. Beggs JM, Plenz D. Neuronal avalanches in neocortical circuits. J Neurosci. 2003;23:11167–11177. - PMC - PubMed
    1. Gireesh ED, Plenz D. Neuronal avalanches organize as nested theta and beta/gamma-oscillations during development of cortical layer 2/3. Proc Natl Acad Sci U S A. 2008;105:7576–7581. - PMC - PubMed
    1. Petermann T, Thiagarajan TC, Lebedev MA, Nicolelis MAL, Chialvo DR, et al. Spontaneous cortical activity in awake monkeys composed of neuronal avalanches. Proc Natl Acad Sci U S A. 2009;106:15921–15926. - PMC - PubMed
    1. Bak P. How nature works: The science of self-organized criticality. Oxford: Oxford University Press; 1997.
    1. Chialvo DR. Critical brain networks. Physica A. 2004;340:756–765.

Publication types