. 2010 Nov 30;5(11):e13942.
doi: 10.1371/journal.pone.0013942.

Emergent properties of tumor microenvironment in a real-life model of multicell tumor spheroids

Affiliations

Emergent properties of tumor microenvironment in a real-life model of multicell tumor spheroids

Edoardo Milotti et al. PLoS One. .

Abstract

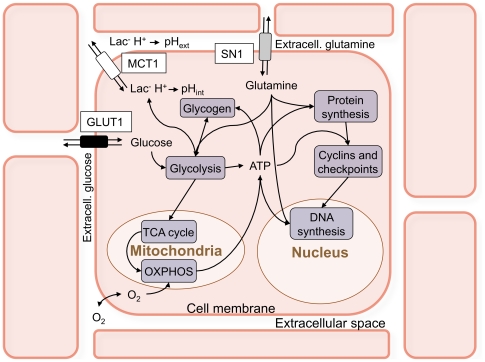
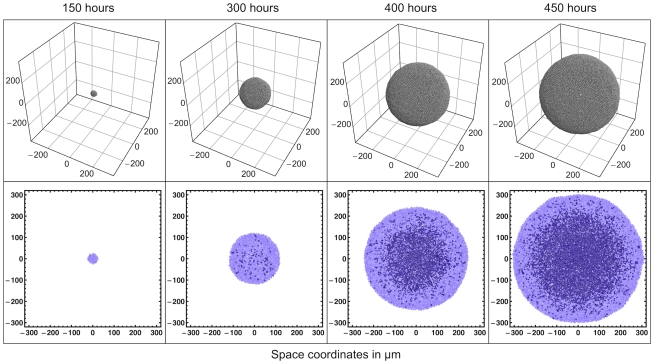
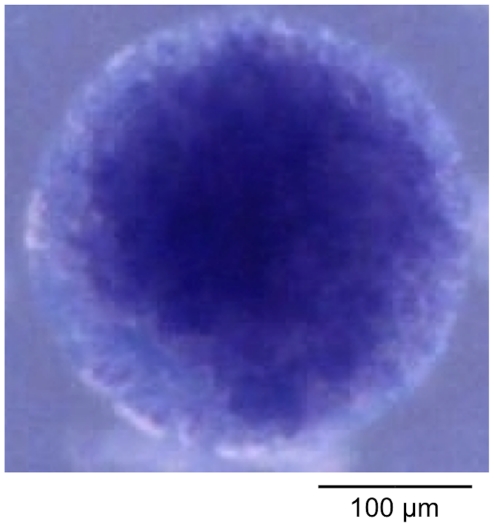
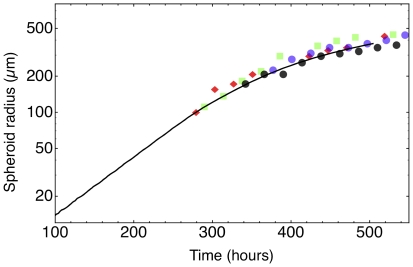
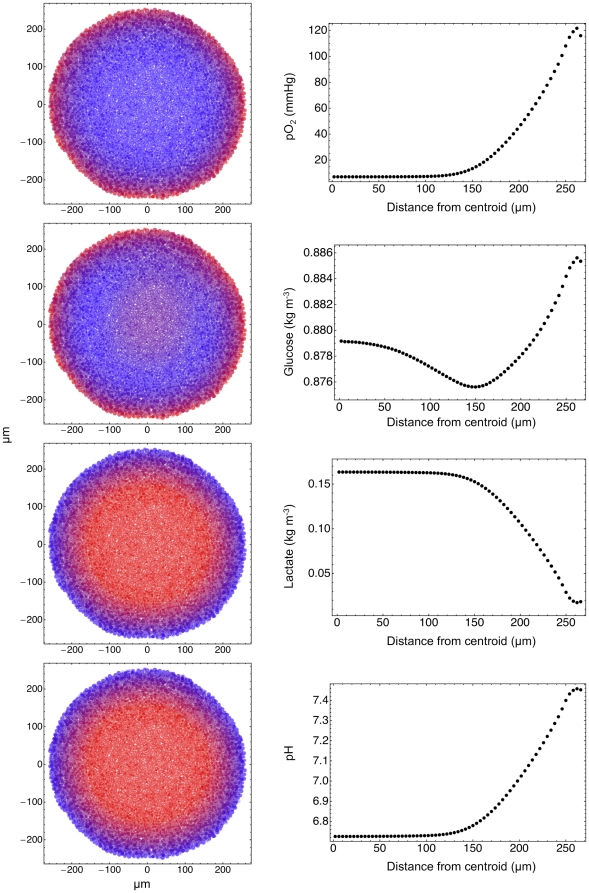
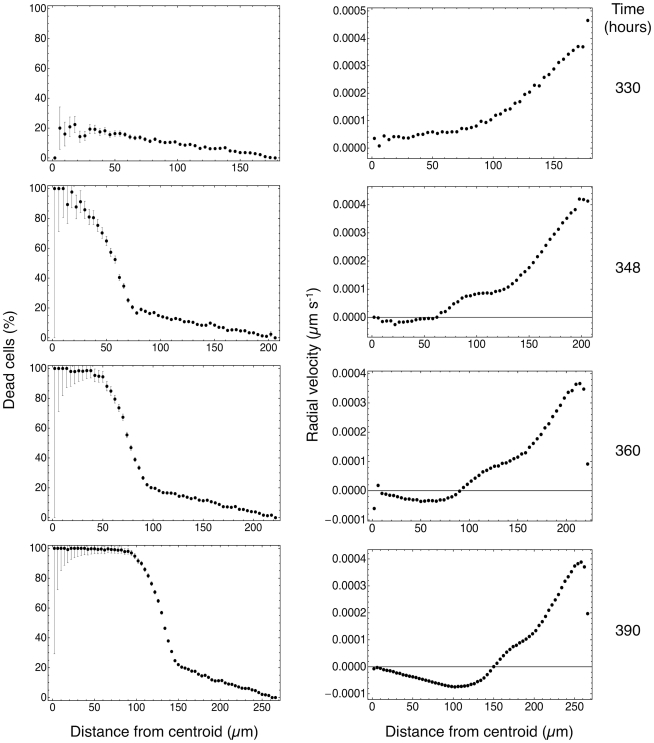
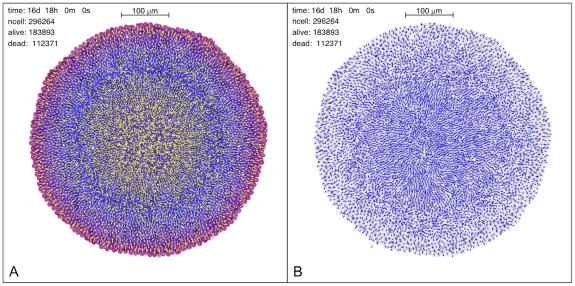
Multicellular tumor spheroids are an important in vitro model of the pre-vascular phase of solid tumors, for sizes well below the diagnostic limit: therefore a biophysical model of spheroids has the ability to shed light on the internal workings and organization of tumors at a critical phase of their development. To this end, we have developed a computer program that integrates the behavior of individual cells and their interactions with other cells and the surrounding environment. It is based on a quantitative description of metabolism, growth, proliferation and death of single tumor cells, and on equations that model biochemical and mechanical cell-cell and cell-environment interactions. The program reproduces existing experimental data on spheroids, and yields unique views of their microenvironment. Simulations show complex internal flows and motions of nutrients, metabolites and cells, that are otherwise unobservable with current experimental techniques, and give novel clues on tumor development and strong hints for future therapies.


Conflict of interest statement

Competing Interests: The authors have declared that no competing interests exist.

Figures

Figure 1
Figure 1. Rough sketch of the biochemical pathways incorporated in the model of single cells.
We take into account the main metabolic pathways (glycolysis, oxidative phosphorylation through the TCA cycle and gluconeogenesis), including the role of mitochondria in the production of ATP. The model also includes protein and DNA synthesis, and checkpoints controlled by representative members of the cyclin family. The single-cell model has two spatial compartments (the inside of the cell and its immediate neighborhood, the extracellular space that surrounds it) and transport of substances between these compartments is regulated by transporters on the cell membrane that are also included in the model. The extracellular space of each cell communicates by simple diffusion with the neighboring extracellular spaces and with the environment. The complete map of the biochemical pathways is shown in figure S2.
Figure 2
Figure 2. Snapshots of one simulated spheroid taken at different times.
As the spheroid grows, a necrotic core develops in its central region, just as it happens in real spheroids. The size of the necrotic core and of the viable cell rim match real measurements.
Figure 3
Figure 3. Photograph of a spheroid grown in vitro from HeLa cells in agar.
The spheroid is colored with trypan blue to mark dead cells, where the necrotic core is clearly visible. The agar contains the spheroid and helps in obtaining a better spherical shape with HeLa cells, but also stifles spheroid growth because it reduces the effective diffusion coefficients in the nourishing medium, so that it cannot be directly compared to the simulated spheroid in the second column of figure 2 (which has the same size), while it is similar to the larger spheroid in third column.
Figure 4
Figure 4. Growth curve of a simulated tumor spheroid (solid line).
The run parameters used in this case are listed in Text S1. The symbols denote data points taken in different in vitro experiments: squares = FSA cells (methylcholantrene-transformed mouse fibroblasts) ; diamonds = MCF7 cells (human breast carcinoma) ; circles = 9L cells (rat glioblastoma) .
Figure 5
Figure 5. Concentrations in the simulated spheroid.
The color coded figures on the left show the partial pressure of oxygen, the concentrations of glucose and lactate in the extracellular spaces, and the pH of the extracellular environment (high values = red, low values = blue). The corresponding plots in the right column show the average values of these quantities vs. the distance from the centroid of the tumor spheroid. The small oscillations in the plots close to the spheroid surface are due to fluctuations in the averaging procedure, because the spheroid is slightly nonspherical.
Figure 6
Figure 6. Plots of the normalized average intracellular concentration of lactate (green), glucose (blue), and ATP (red).
These plots have been obtained in the same simulation and at the same time step as the plots of figure 5, and each concentration is normalized to its peak value. These plots indicate that cell death in the central region is due both to the accumulation of metabolites (lactate) and to metabolic stress (starvation).
Figure 7
Figure 7. Fraction of dead cells (left column) and average radial velocity (right column) at different times.
As the spheroid grows, the necrotic core becomes increasingly well defined, and as dead cells shrink, the radial velocity changes sign and a marked inward motion characterizes the central region.
Figure 8
Figure 8. Two views of the microstructure of a simulated spheroid, with about diameter and 296264 cells (183893 live cells+112371 dead cells).
(Left panel): flow of extracellular glucose along a central section of the tumor spheroid (yellow arrows) superposed on the plot of glucose concentration. The length of the arrows is proportional to the glucose flow intensity projected on the plane of the section. At this stage, the necrotic core is contracting as dead cells gradually shrink, and this leads to a slow outward flow of the glucose stored in the extracellular spaces in this central region. We observe that such a behavior depends on the effective diffusion coefficient of glucose, and it disappears completely when the diffusion coefficient is high enough. This also suggests that the flow of glucose and other substances, like therapeutic drugs, is strongly dependent on the biochemistry and structure of extracellular spaces, and even small changes can lead to markedly different internal spheroid morphologies. (Right panel): individual cell velocities in the simulated spheroid. This is the same central section as in the left panel, and the velocity vectors are projected on the plane of the section. The length of each vector is proportional to the projected speed. The velocities in the viable rim show a coherent outward motion, while the velocities in the necrotic core show a rather orderly inward motion, with some vortices due to local residual cell proliferation. The region in-between is somewhat chaotic and the global structure of this plot mirrors that of the glucose flow shown on the left. The supporting information includes higher-quality versions of these figures and those of other flows.
Figure 9
Figure 9. Functional blocks of the simulation program.
Program initialization is followed by a loop that performs biochemical and biomechanical calculations. This is followed by a check of the status of individual cells – this is where we decide whether a cell advances in the cell cycle, undergoes mitosis, or dies. Next the program computes the geometry and the topology of the cell cluster, and finally it outputs intermediate statistics and results. The loop continues until a user-defined stop condition is met. Some parts of the program can proceed in parallel (like metabolism and cell motion), and we can use multithreaded code.
Figure 10
Figure 10. Functional blocks of the C++ method that computes metabolic and extracellular variables.
This part performs a loop that computes the solution of the nonlinear equations found in the implicit Euler integration step (see also Text S1). Although the number of variables can be quite large (more than formula image 
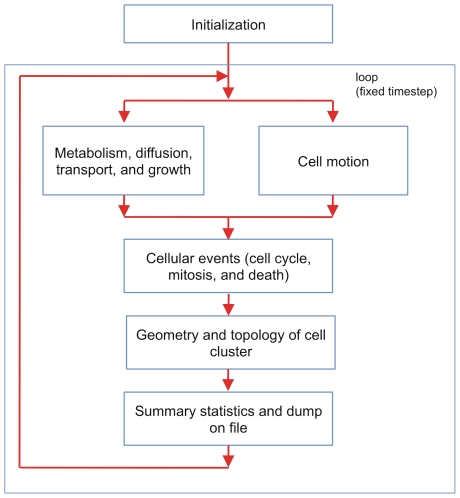
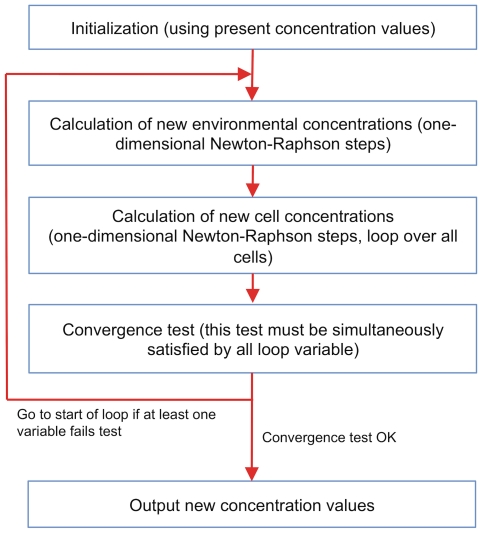
variables), convergence is fast, because the initial concentration values are invariably very close to the final ones.

References

    1. Sutherland RM. Cell and environment interactions in tumor microregions: the multicell spheroid model. Science. 1988;240:177–84. - PubMed
    1. Bjerkvig R. Spheroid Culture in Cancer Research. Boca Raton, Fla.: CRC Press; 1992.
    1. Mueller-Klieser W. Three-dimensional cell cultures: from molecular mechanisms to clinical applications. Am J Physiol. 1997;273:C1109–23. - PubMed
    1. Mueller-Klieser W. Tumor biology and experimental therapeutics. Crit Rev Oncol Hematol. 2000;36:123–39. - PubMed
    1. Gottfried E, Kunz-Schughart LA, Andreesen R, Kreutz M. Brave little world: spheroids as an in vitro model to study tumor-immune-cell interactions. Cell Cycle. 2006;5:691–695. - PubMed

Publication types