. 2010 Nov 30;5(11):e14135.
doi: 10.1371/journal.pone.0014135.

Biased signaling of the angiotensin II type 1 receptor can be mediated through distinct mechanisms

Affiliations

Biased signaling of the angiotensin II type 1 receptor can be mediated through distinct mechanisms

Marie Mi Bonde et al. PLoS One. .

Abstract

Background: Seven transmembrane receptors (7TMRs) can adopt different active conformations facilitating a selective activation of either G protein or β-arrestin-dependent signaling pathways. This represents an opportunity for development of novel therapeutics targeting selective biological effects of a given receptor. Several studies on pathway separation have been performed, many of these on the Angiotensin II type 1 receptor (AT1R). It has been shown that certain ligands or mutations facilitate internalization and/or recruitment of β-arrestins without activation of G proteins. However, the underlying molecular mechanisms remain largely unresolved. For instance, it is unclear whether such selective G protein-uncoupling is caused by a lack of ability to interact with G proteins or rather by an increased ability of the receptor to recruit β-arrestins. Since uncoupling of G proteins by increased ability to recruit β-arrestins could lead to different cellular or in vivo outcomes than lack of ability to interact with G proteins, it is essential to distinguish between these two mechanisms.

Methodology/principal findings: We studied five AT1R mutants previously published to display pathway separation: D74N, DRY/AAY, Y292F, N298A, and Y302F (Ballesteros-Weinstein numbering: 2.50, 3.49-3.51, 7.43, 7.49, and 7.53). We find that D74N, DRY/AAY, and N298A mutants are more prone to β-arrestin recruitment than WT. In contrast, receptor mutants Y292F and Y302F showed impaired ability to recruit β-arrestin in response to Sar1-Ile4-Ile8 (SII) Ang II, a ligand solely activating the β-arrestin pathway.

Conclusions/significance: Our analysis reveals that the underlying conformations induced by these AT1R mutants most likely represent principally different mechanisms of uncoupling the G protein, which for some mutants may be due to their increased ability to recruit β-arrestin2. Hereby, these findings have important implications for drug discovery and 7TMR biology and illustrate the necessity of uncovering the exact molecular determinants for G protein-coupling and β-arrestin recruitment, respectively.


Conflict of interest statement

Competing Interests: The authors have declared that no competing interests exist.

Figures

Figure 1
Figure 1. Schematic presentation of possible mechanisms underlying differential activation.
Hypothetically, a receptor mutant selectively activating β-arrestin induced pathways could either be impaired in G protein-coupling (right) or show very strong interaction with β-arrestins (left).
Figure 2
Figure 2. Schematic presentation of the residues targeted for mutations in a snake diagram of the rAT1aR.
Residues mutated in this study are highlighted in black. These include the conserved DRY motif in the cytoplasmic part of TM3, the NPXXY motif in the cytoplasmic part of TM7, and the aspartic acid in TM2. Residues removed by truncation are shown in grey. The conserved residues indexed to the number 50 in the Ballesteros-Weinstein numbering scheme are highlighted in bold .
Figure 3
Figure 3. Cell surface expression determined by ELISA.
Cell surface expression (black bars) and total protein levels (white bars) were determined by whole cell ELISA using M1 anti-FLAG antibody on COS-7 cells transiently transfected with FLAG-tagged rAT1aRs. Total protein levels were estimated by permeabilizing cells with 0.1% Triton-X100. Data were normalized by first subtracting values for no primary antibody and secondly subtracting values for mock transfected cells. Data are means and S.E.M.s from at least 5 independent experiments.
Figure 4
Figure 4. Ang II whole cell competition binding.
Normalized competition binding curves from experiments using 1nM 3H-Ang II as tracer and increasing amounts of unlabeled Ang II. Experiments were conducted on COS-7 cells transiently transfected with FLAG-tagged rAT1aRs. WT full length and truncated receptor curves are shown in bold, curves of truncated receptors are shown as dashed lines. For each receptor, curves were normalized in GraphPad Prism by defining the fitted bottom value as 0% and top value as 100%. Normalized curves were summarized from at least 3 independent experiments performed in triplicates, means and S.E.M.s are shown. n's are reported in table 1. Experimental details can be found in the Materials and Methods section.
Figure 5
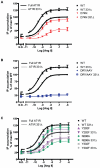
Figure 5. Ang II induced IP accumulation.
A, B, and C: Dose-response curves normalized to the fitted maximum for WT AT1R compiled from at least 5 independent experiments performed in triplicates (mean and S.E.M.). WT and WT 331Δ have been included on all graphs for comparison. A: D74N. B: DRY/AAY. C: Receptor mutants: Y292F, N298A, and Y302F. Experiments were conducted on COS-7 cells transiently transfected with FLAG-tagged rAT1aR. WT full length and truncated receptor curves are shown in bold, curves of truncated receptors are shown as dotted lines. Experimental details can be found in the Material and Methods section. n's are reported in table 2. N.D. = no drug.
Figure 6
Figure 6. β-arrestin2 recruitment by BRET.
Dose-response curves normalized to the fitted maximum for WT AT1R stimulated with Ang II compiled from at least 4 independent experiments performed in duplicate (mean and S.E.M.). All values are shown as percent of the maximal response with Ang II on WT AT1R. WT AT1R and WT 331Δ AT1R have been included on graphs for comparison. A–C: Stimulation with AngII. C, D–F: Stimulation with SII Ang II. A: D74N. B: DRY/AAY. C: Y292F, N298A, and Y302F. D: D74N. E: Receptor mutants: DRY/AAY and N298A. F: Receptor mutants: Y292F and Y302F. Experiments were conducted on HEK293 cells transiently co-transfected with Luc-tagged rAT1aRs in combination with GFP2-tagged β-arrestin2. Curves of full length receptors are shown as full lines, and curves of truncated receptors are shown as dashed lines. WT full length and truncated receptor curves are shown in bold. N.D. = no drug. Experimental details can be found in the Material and Methods section. n's are reported in table 3.
Figure 7
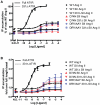
Figure 7. SII Ang II induced IP accumulation.
A: Dose-response curves normalized to the fitted maximum response for WT AT1R compiled from at least 3 independent experiments performed in triplicates (mean and S.E.M.). B: Dose-response curves normalized to no drug (N.D.) response for the full length receptor. In this graph, one data set for DRY/AAY 331Δ had to be left out due to missing values for full length DRY/AAY on that particular assay date. Experimental setup as in figure 5.
Figure 8
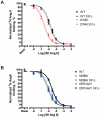
Figure 8. SII Ang II affinity.
Normalized competition binding curves from experiments using 1nM 3H-Ang II as tracer and increasing amounts of unlabeled SII Ang II. Experiments were conducted on COS-7 cells transiently transfected with FLAG-tagged rAT1aRs. WT full length and truncated receptor curves are shown in bold, curves of truncated receptors are shown as dashed lines. For each receptor, curves were normalized in GraphPad Prism by defining the fitted bottom value as 0% and top value as 100%. Normalized curves were summarized from at least 3 independent experiments performed in triplicates, means and S.E.M.s are shown. pKi values and n's are reported in table 4. Experimental details can be found in the Material and Methods section. A: WT and D74N. B: DRY/AAY and N298A.
Figure 9
Figure 9. β-arrestin2 recruitment with G protein overexpression.
Dose-response curves of Ang II-induced β-arrestin2 recruitment determined by BRET1. Normalized curves compiled from four independent experiments performed in triplicates and standard errors are shown. Differences in response between cells overexpressing Gαq protein or not were measured by BRET1. Response is defined as: no drug value subtracted from average of 10−6 and 10−5 M Ang II values. * indicates p<0.05 determined by paired Student's t-test to WT values.
Figure 10
Figure 10. IP accumulation with overexpression of β-arrestin2 and G protein.
Dose-response curves of Ang II stimulation normalized to the fitted maximum for WT AT1R plus G protein compiled from four independent experiments performed in triplicates (mean and S.E.M.). WT has been included on all graphs for comparison. A: D74N. B: DRY/AAY. C: Y302F. Experiments were conducted on transiently transfected HEK293 cells. N.D. = no drug.
Figure 11
Figure 11. Schematic overview of different phenotypes of the mutants.
Schematic presentation of how the residues mutated in this study could hypothetically affect the induction of different conformations. These interpretations are based on the data included in this study and should be considered with the precautions mentioned in the Discussion section.

References

    1. Aplin M, Christensen GL, Hansen JL. Pharmacologic perspectives of functional selectivity by the angiotensin II type 1 receptor. Trends Cardiovasc Med. 2008;18:305–312. - PubMed
    1. Kendall RT, Luttrell LM. Diversity in arrestin function. Cell Mol Life Sci. 2009;66:2953–2973. - PMC - PubMed
    1. Nygaard R, Frimurer TM, Holst B, Rosenkilde MM, Schwartz TW. Ligand binding and micro-switches in 7TM receptor structures. Trends Pharmacol Sci. 2009;30:249–259. - PubMed
    1. Rosenbaum DM, Rasmussen SG, Kobilka BK. The structure and function of G-protein-coupled receptors. Nature. 2009;459:356–363. - PMC - PubMed
    1. Ballesteros JA, Shi L, Javitch JA. Structural mimicry in G protein-coupled receptors: implications of the high-resolution structure of rhodopsin for structure-function analysis of rhodopsin-like receptors. Mol Pharmacol. 2001;60:1–19. - PubMed

Publication types

MeSH terms