Characterization of respiratory drug delivery with enhanced condensational growth using an individual path model of the entire tracheobronchial airways
- PMID: 21152983
- PMCID: PMC3042232
- DOI: 10.1007/s10439-010-0223-z
Characterization of respiratory drug delivery with enhanced condensational growth using an individual path model of the entire tracheobronchial airways
Abstract
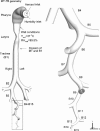
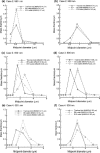
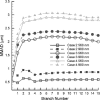
The objective of this study was to evaluate the delivery of inhaled pharmaceutical aerosols using an enhanced condensational growth (ECG) approach in an airway model extending from the oral cavity to the end of the tracheobronchial (TB) region. The geometry consisted of an elliptical mouth-throat (MT) model, the upper TB airways extending to bifurcation B3, and a subsequent individual path model entering the right lower lobe of the lung. Submicrometer monodisperse aerosols with diameters of 560 and 900 nm were delivered to the mouth inlet under control (25 °C with subsaturated air) or ECG (39 or 42 °C with saturated air) conditions. Flow fields and droplet characteristics were simulated using a computational fluid dynamics model that was previously demonstrated to accurately predict aerosol size growth and deposition. Results indicated that both the control and ECG delivery cases produced very little deposition in the MT and upper TB model (approximately 1%). Under ECG delivery conditions, large size increases of the aerosol droplets were observed resulting in mass median aerodynamic diameters of 2.4-3.3 μm exiting B5. This increase in aerosol size produced an order of magnitude increase in aerosol deposition within the TB airways compared with the controls, with TB deposition efficiencies of approximately 32-46% for ECG conditions. Estimates of downstream pulmonary deposition indicted near full lung retention of the aerosol during ECG delivery. Furthermore, targeting the region of TB deposition by controlling the inlet temperature conditions and initial aerosol size also appeared possible.
Figures


References
-
- Asgharian B, Price OT. Airflow distribution in the human lung and its influence on particle deposition. Inhal. Toxicol. 2006;18:795–801. - PubMed
-
- Asgharian B, Price OT, Hofmann W. Prediction of particle deposition in the human lung using realistic models of lung ventilation. Aerosol Sci. 2006;37:1209–1221.
-
- Azarmi S, Roa WH, Lobenberg R. Targeted delivery of nanoparticles for the treatment of lung diseases. Adv. Drug Deliv. Rev. 2008;60:863–875. - PubMed
-
- Borgstrom L, Olsson B, Thorsson L. Degree of throat deposition can explain the variability in lung deposition of inhaled drugs. J. Aerosol Med. 2006;19:473–483. - PubMed
-
- Byron PR. Drug delivery devices: issues in drug development. Proc. Am. Thorac. Soc. 2004;1:321–328. - PubMed
Publication types
MeSH terms
Substances
Grants and funding
LinkOut - more resources
Full Text Sources
Other Literature Sources

