. 2011 Apr;28(4):797-811.
doi: 10.1007/s11095-010-0333-1. Epub 2010 Dec 14.

Systematic evaluation of the descriptive and predictive performance of paediatric morphine population models

Affiliations

Systematic evaluation of the descriptive and predictive performance of paediatric morphine population models

Elke H J Krekels et al. Pharm Res. 2011 Apr.

Abstract

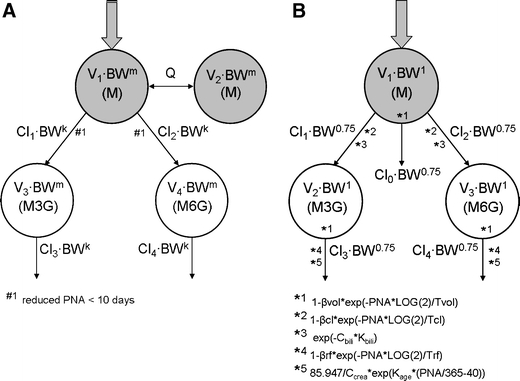
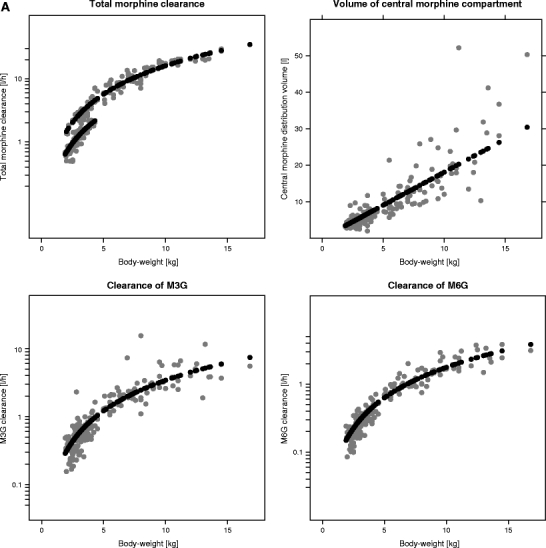
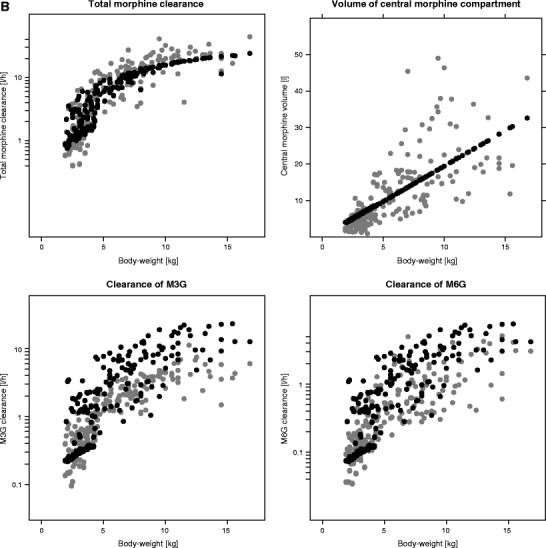
Purpose: A framework for the evaluation of paediatric population models is proposed and applied to two different paediatric population pharmacokinetic models for morphine. One covariate model was based on a systematic covariate analysis, the other on fixed allometric scaling principles.

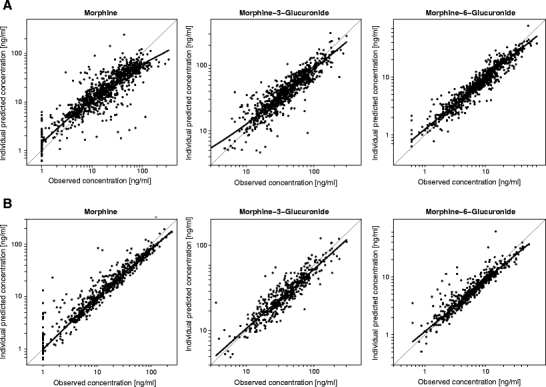
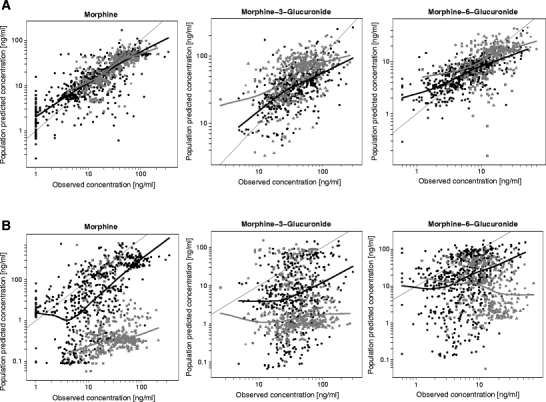
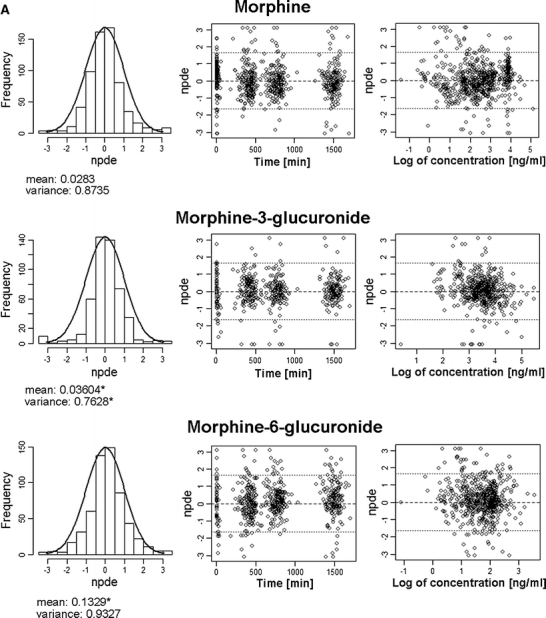
Methods: The six evaluation criteria in the framework were 1) number of parameters and condition number, 2) numerical diagnostics, 3) prediction-based diagnostics, 4) η-shrinkage, 5) simulation-based diagnostics, 6) diagnostics of individual and population parameter estimates versus covariates, including measurements of bias and precision of the population values compared to the observed individual values. The framework entails both an internal and external model evaluation procedure.

Results: The application of the framework to the two models resulted in the detection of overparameterization and misleading diagnostics based on individual predictions caused by high shrinkage. The diagnostic of individual and population parameter estimates versus covariates proved to be highly informative in assessing obtained covariate relationships. Based on the framework, the systematic covariate model proved to be superior over the fixed allometric model in terms of predictive performance.

Conclusions: The proposed framework is suitable for the evaluation of paediatric (covariate) models and should be applied to corroborate the descriptive and predictive properties of these models.


Figures

Fig. 1
Fig. 1
Schematic representation of the systematic covariate model (1) (A) and the fixed allometric model (4) (B). M = morphine, M3G = morphine-3-glucuronide, M6G = morphine-6-glucuronide, V = distribution volume of the designated compartment, Cl = clearance of designated route, Q = inter-compartmental clearance, PNA = postnatal age, k and m = exponential scaling constants, β = fraction below adult values at birth and T = maturation half-life for distribution volume (vol), formation clearance of the metabolites (cl), and elimination clearance of the metabolites (rf), C = plasma concentration and K = scaling constant for bilirubin (bili) and creatinine (crea).
Fig. 2
Fig. 2
Individual predicted concentrations versus observed concentrations including a loess curve of morphine and its metabolites in the internal dataset Predictions by the systematic covariate model are depicted in panel A, and predictions by the fixed allometric model in panel B.
Fig. 3
Fig. 3
Population predicted concentrations versus observed concentrations including loess curves of morphine and its metabolites for the systematic covariate model (A) and fixed allometric model (B). Data points in black originate from the internal dataset and data points in grey from the external datasets. Different symbols are used for different external datasets: ■ = Ext. 1(9), ● = Ext 2(10), ♦ = Ext 3(11),* Ext 4(7), ▲ = Ext 5(8).
Fig. 4
Fig. 4
Result of the NPDE analysis for morphine and its metabolites using the internal dataset with the systematic covariate model (A) and the fixed allometric model (B). In the histograms the distributions of the NPDEs for morphine and its metabolites in the total dataset are shown. The solid line depicts a normal distribution, and the values below specify the mean and variance of the observed NPDE distribution in the histogram. A statistically significant deviation of the distribution from a mean of 0 and a variance of 1 is indicated with an asterisk (*). The distributions of NPDEs in time after first dose and against the observed concentrations are also shown. As for the systematic covariate model, log-transformed data have been used; the last plot shows the NPDE against the log-value of the observed concentration.
Fig. 4
Fig. 4
Result of the NPDE analysis for morphine and its metabolites using the internal dataset with the systematic covariate model (A) and the fixed allometric model (B). In the histograms the distributions of the NPDEs for morphine and its metabolites in the total dataset are shown. The solid line depicts a normal distribution, and the values below specify the mean and variance of the observed NPDE distribution in the histogram. A statistically significant deviation of the distribution from a mean of 0 and a variance of 1 is indicated with an asterisk (*). The distributions of NPDEs in time after first dose and against the observed concentrations are also shown. As for the systematic covariate model, log-transformed data have been used; the last plot shows the NPDE against the log-value of the observed concentration.
Fig. 5
Fig. 5
Individual post hoc parameter estimates (grey) and population predicted parameter estimates (black) for total morphine clearance (Cl1 + Cl2 for the systematic covariate model and Cl0 + Cl1 + Cl2 for the fixed allometric model), the elimination clearances of the metabolites (Cl 3 and Cl 4) and distribution volume of the central morphine compartment (V 1) versus body-weight for the systematic covariate model (A) and the fixed allometric model (B).
Fig. 5
Fig. 5
Individual post hoc parameter estimates (grey) and population predicted parameter estimates (black) for total morphine clearance (Cl1 + Cl2 for the systematic covariate model and Cl0 + Cl1 + Cl2 for the fixed allometric model), the elimination clearances of the metabolites (Cl 3 and Cl 4) and distribution volume of the central morphine compartment (V 1) versus body-weight for the systematic covariate model (A) and the fixed allometric model (B).

References

    1. Knibbe CA, Krekels EH, van den Anker JN, et al. Morphine glucuronidation in preterm neonates, infants and children younger than 3 years. Clin Pharmacokinet. 2009;48(6):371–385. doi: 10.2165/00003088-200948060-00003. - DOI - PubMed
    1. Peeters MY, Prins SA, Knibbe CA, et al. Propofol pharmacokinetics and pharmacodynamics for depth of sedation in nonventilated infants after major craniofacial surgery. Anesthesiology. 2006;104(3):466–474. doi: 10.1097/00000542-200603000-00013. - DOI - PubMed
    1. de Cock RF, Piana C, Krekels EH, Danhof M, Allegaert K, Knibbe CA. The role of population PK-PD modelling in paediatric clinical research. Eur J Clin Pharmacol. 2010. - PMC - PubMed
    1. Bouwmeester NJ, Anderson BJ, Tibboel D, Holford NH. Developmental pharmacokinetics of morphine and its metabolites in neonates, infants and young children. Br J Anaesth. 2004;92(2):208–217. doi: 10.1093/bja/aeh042. - DOI - PubMed
    1. Anderson BJ, Allegaert K, Holford NH. Population clinical pharmacology of children: modelling covariate effects. Eur J Pediatr. 2006;165(12):819–829. doi: 10.1007/s00431-006-0189-x. - DOI - PubMed

Publication types