. 2011 Jul;41(4):593-606.
doi: 10.1007/s10519-010-9418-1. Epub 2010 Dec 14.

Mapping Loci for fox domestication: deconstruction/reconstruction of a behavioral phenotype

Affiliations

Mapping Loci for fox domestication: deconstruction/reconstruction of a behavioral phenotype

Anna V Kukekova et al. Behav Genet. 2011 Jul.

Abstract

During the second part of the twentieth century, Belyaev selected tame and aggressive foxes (Vulpes vulpes), in an effort known as the "farm-fox experiment", to recapitulate the process of animal domestication. Using these tame and aggressive foxes as founders of segregant backcross and intercross populations we have employed interval mapping to identify a locus for tame behavior on fox chromosome VVU12. This locus is orthologous to, and therefore validates, a genomic region recently implicated in canine domestication. The tame versus aggressive behavioral phenotype was characterized as the first principal component (PC) of a PC matrix made up of many distinct behavioral traits (e.g. wags tail; comes to the front of the cage; allows head to be touched; holds observer's hand with its mouth; etc.). Mean values of this PC for F1, backcross and intercross populations defined a linear gradient of heritable behavior ranging from tame to aggressive. The second PC did not follow such a gradient, but also mapped to VVU12, and distinguished between active and passive behaviors. These data suggest that (1) there are at least two VVU12 loci associated with behavior; (2) expression of these loci is dependent on interactions with other parts of the genome (the genome context) and therefore varies from one crossbred population to another depending on the individual parents that participated in the cross.


Figures

Figure 1
Figure 1. Population distributions for the first two principal components of silver fox behavior
a. Distributions for principal component 1 (PC1); b. Distributions for PC2. Aggr = “aggressive” founder population; BCA = backcross-to-aggressive; F2_1 and F2_2 = two F2 populations (F1 × F1); F1 = F1 population (“tame” × “aggressive”); BCT_1 and BCT_2 = two backcross-to-tame populations; Tame = “tame” founder population. Horizontal bars within each box indicate the population median. Confidence intervals for the medians are shown as notches such that two distributions with non overlapping notches are significantly different (p = 0.05). The bottom and top edges of the boxes indicate the 25 and 75 percentiles. The whiskers indicate the range of data up to 1.5 times the interquartile range. Outliers are shown as individual circles. PC1 in the different populations exhibits a gradient, spanning the behavioral variation between that of the parental populations, that conforms to the expectation for a heritable component consistent with the overall contribution from “Tame” and “Aggressive” ancestry. This is clearly not the case for PC2.
Figure 2
Figure 2. Interval mapping of the first principal component of silver fox behavior
Interval mapping of PC1, using GridQTL software, was undertaken on a combined data set including all experimental silver fox populations. The F stat (y-axis) is graphed as a function of cM distance across the VVU12 chromosome. Interval mapping across all populations yields supports for a PC1-associated loci on VVU12, located broadly between 10 and 60 cM, that exceeds the threshold for genome wide association at a significance level p< 0.05 (Table III), and confirms the mapping in individual populations (see Tables I, II, and III).
Figure 3
Figure 3. Interval mapping of 3 fox behavorial traits defined by ear position, in 3 different segregating populations
For each trait, the signed F statistic (y-axis) from GridQTL is plotted as a function of cM distance across VVU12 (x-axis). The sign of the F statistic indicates the direction and parent-of-origin of the additive allele effect (i.e. positivity indicates that the allele originating from the tame population increases the frequency of the observed trait in the segregating population, and negativity indicates that the “tame” allele decreases the trait frequency). a. Trait C12, “Tame ears”, in populations BCT_1 and BCT_2; b. Trait B25, “Pinned ears”, in F2, BCT_1 and BCT_2; c. Trait C35, “Narrow ears directed back”, in F2, BCT_1 and BCT_2. BCT_1 = dotted line, BCT_2 = dot dash line, F2 = dashed line. In plots a and c, where BCT_1 and BCT_2 differ with significance p< 0.001, the plot lines are emphasized with stars. Traits C12 (“Tame ears”, plot a) and C35 (“Narrow ears directed back”, plot c) map in a complementary manner. In BCT_2 a QTL maps near 100 cM for which the “tame” allele decreases the frequency of observation of trait C12 (a) and increases the frequency of C35 (c). In BCT_1 this QTL has either no effect, or a small effect of opposite sign; and no QTL effect is evident in the F2 population. The difference in effect between BCT_1 and BCT_2 is highly significant. Trait B25 (“pinned ears”, a behavior typical of foxes in the aggressive founder population) yields no support for a QTL near 100 cM in any of the 3 segregating populations, or anywhere on VVU12 in BCT_2, but does suggest a QTL in the 0-60cM interval in the F2 and BCT_1 populations, with a tame allele having a positive effect on trait frequency.
Figure 4
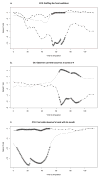
Figure 4. Interval mapping of 3 “confrontational” fox behavorial traits, in different segregating populations
Plot formats and symbols as in Figure 3. a. Trait B15, “Sniffing the front wall/door [of cage]”, in populations F2, BCT_1 and BCT_2; b. Trait C6, “Observer can first touch fox in zones 3–4”, in populations BCT_1 and BCT_2; c. Trait C18, “Fox holds observer’s hand with its mouth”, in populations BCT_1 and BCT_2. Traits B15 and C6 support a QTL in the approximately 60–90 cM interval, for which the “tame” allele has negative effect (i.e. decreasing trait frequency) in BCT_2, but has no (B15) or a small positive effect (C6) in BCT_1 -- this difference is significant at p< 0.001. Trait C18 shows no support for a QTL anywhere on VVU12 in BCT_2, but in BCT_1 there is support for a QTL in the 0–60 cM interval, with the tame allele having negative effect, and this difference between BCT_2 and BCT_1 is also significant at p< 0.001.
Figure 5
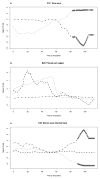
Figure 5. Interval mapping of 3 “aggressive” fox behavioral traits, in segregating populations BCT_1, BCT_2, F2, and BCA
Continuous line = backcross-to-aggressive (BCA) population, otherwise plot formats and symbols as in Figure 3. a. Trait C37 (“Aggressive sounds”); b. Trait C30 (“Attack”); c. Trait C33 (“Trying to bite”). Trait C37 segregates in BCT_2 with a QTL at around 100 cM (a), with a “tame” allele having, counterintuitively, a positive effect (increasing trait frequency); no such effect is seen in the other populations, and the difference between BCT_2 and BCT_1 is significant at p< 0.001. Trait C30 is associated with a QTL in both the BCT_2 and BCA populations, in the 0–20 cM interval on VVU12, for which the “tame” allele has negative effect (reducing trait frequency), but this is not seen in BCT_1 or F2 populations. The difference between BCT_2 and BCT_1 for trait C30 is also significant at p< 0.001. There is no evidence for any QTL effect for trait C30 in the 60–100 cM interval in any of the populations. Trait C33 maps to the 0–60 cM region in F2 and BCT_2 populations but with the opposite effect. The same allele apparently has no effect in the BCT_1 population.
Figure 6
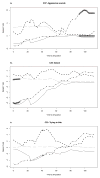
Figure 6. Interval mapping of 3 “positional” fox behavorial traits, in segregating populations F2, BCT_1 and BCT_2
Plot formats and symbols as in Figure 3. a. Trait B11 (“[Fox] comes into zones 1–2”); b. Trait B2 (“[Fox] immediately moved back to zone 5 or 3-5-6 ”); c. Trait D14 (“[Fox] sits in zone 2 looking at observer”). In the BCT_2 population a QTL mapping broadly to the 60-100cM interval on VVU12 influences the observed frequency of all 3 traits. The direction of the effect is negative for traits B11 and D14 (i.e. the “tame” allele reduces the trait frequency), and positive for trait B2. The effect of this QTL is not apparent in the other populations.

References

    1. Albert FW, Carlborg O, Plyusnina I, Besnier F, Hedwig D, Lautenschläger S, Lorenz D, McIntosh J, Neumann C, Richter H, Zeising C, Kozhemyakina R, Shchepina O, Kratzsch J, Trut L, Teupser D, Thiery J, Schöneberg T, Andersson L, Pääbo S. Genetic architecture of tameness in a rat model of animal domestication. Genetics. 2009;182(2):541–54. - PMC - PubMed
    1. Gácsi M, Miklósi A, Varga O, Topál J, Csányi V. Are readers of our face readers of our minds? Dogs (Canis familiaris) show situation-dependent recognition of human’s attention. Anim Cogn. 2004;7(3):144–53. - PubMed
    1. Gácsi M, Gyori B, Miklósi A, Virányi Z, Kubinyi E, Topál J, Csányi V. Species-specific differences and similarities in the behavior of hand-raised dog and wolf pups in social situations with humans. Dev Psychobiol. 2005;47(2):111–22. - PubMed
    1. Gácsi M, Györi B, Virányi Z, Kubinyi E, Range F, Belényi B, Miklósi A. Explaining dog wolf differences in utilizing human pointing gestures: selection for synergistic shifts in the development of some social skills. PLoS One. 2009;4(8):e6584. - PMC - PubMed
    1. Gilbert JR, Vance JM. Current Protocols in Human Genetics. John Wiley and Sons; New York: 1994. Isolation of genomic DNA from mammalian cells; pp. 1–6. Appendix A.3B.

Publication types

LinkOut - more resources