

DNA methylation in glioblastoma: impact on gene expression and clinical outcome
- PMID: 21156036
- PMCID: PMC3018478
- DOI: 10.1186/1471-2164-11-701
DNA methylation in glioblastoma: impact on gene expression and clinical outcome
Abstract
Background: Changes in promoter DNA methylation pattern of genes involved in key biological pathways have been reported in glioblastoma. Genome-wide assessments of DNA methylation levels are now required to decipher the epigenetic events involved in the aggressive phenotype of glioblastoma, and to guide new treatment strategies.
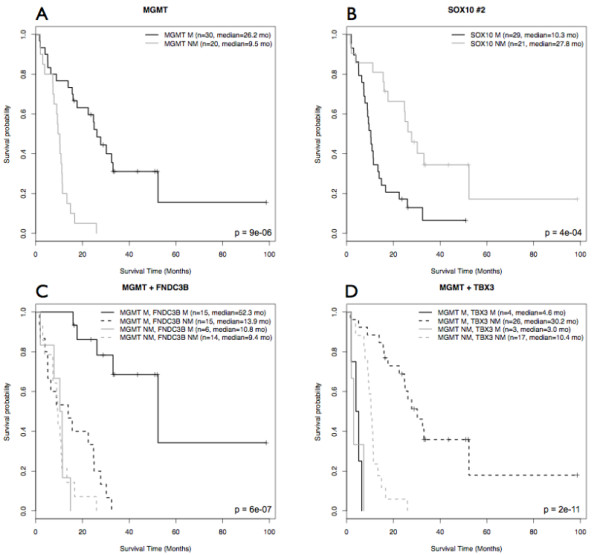
Results: We performed a whole-genome integrative analysis of methylation and gene expression profiles in 40 newly diagnosed glioblastoma patients. We also screened for associations between the level of methylation of CpG sites and overall survival in a cohort of 50 patients uniformly treated by surgery, radiotherapy and chemotherapy with concomitant and adjuvant temozolomide (STUPP protocol). The methylation analysis identified 616 CpG sites differentially methylated between glioblastoma and control brain, a quarter of which was differentially expressed in a concordant way. Thirteen of the genes with concordant CpG sites displayed an inverse correlation between promoter methylation and expression level in glioblastomas: B3GNT5, FABP7, ZNF217, BST2, OAS1, SLC13A5, GSTM5, ME1, UBXD3, TSPYL5, FAAH, C7orf13, and C3orf14. Survival analysis identified six CpG sites associated with overall survival. SOX10 promoter methylation status (two CpG sites) stratified patients similarly to MGMT status, but with a higher Area Under the Curve (0.78 vs. 0.71, p-value < 5e-04). The methylation status of the FNDC3B, TBX3, DGKI, and FSD1 promoters identified patients with MGMT-methylated tumors that did not respond to STUPP treatment (p-value < 1e-04).
Conclusions: This study provides the first genome-wide integrative analysis of DNA methylation and gene expression profiles obtained from the same GBM cohort. We also present a methylome-based survival analysis for one of the largest uniformly treated GBM cohort ever studied, for more than 27,000 CpG sites. We have identified genes whose expression may be tightly regulated by epigenetic mechanisms and markers that may guide treatment decisions.
Figures
References
-
- de Tayrac M, Etcheverry A, Aubry M, Saikali S, Hamlat A, Quillien V, Le Treut A, Galibert MD, Mosser J. Integrative genome-wide analysis reveals a robust genomic glioblastoma signature associated with copy number driving changes in gene expression. Genes Chromosomes Cancer. 2009;48:55–68. doi: 10.1002/gcc.20618. - DOI - PubMed
-
- Nigro JM, Misra A, Zhang L, Smirnov I, Colman H, Griffin C, Ozburn N, Chen M, Pan E, Koul D. et al. Integrated array-comparative genomic hybridization and expression array profiles identify clinically relevant molecular subtypes of glioblastoma. Cancer Res. 2005;65:1678–1686. doi: 10.1158/0008-5472.CAN-04-2921. - DOI - PubMed
Publication types
MeSH terms
Substances
LinkOut - more resources
Full Text Sources
Other Literature Sources
Molecular Biology Databases
Research Materials
Miscellaneous
