

Consistency of fat mass--fat-free mass relationship across ethnicity and sex groups
- PMID: 21156087
- PMCID: PMC3960800
- DOI: 10.1017/S0007114510004794
Consistency of fat mass--fat-free mass relationship across ethnicity and sex groups
Abstract
The model developed by Forbes (1987) of how body fat mass (FM) and fat-free mass (FFM) change during periods of weight loss or gain (Δ body weight (BW)) assumed that they change in relationship to a constant C = 10·4, where ΔFFM/ΔBW = 10·4/(10·4+FM). Forbes derived C based on aggregated, cross-sectional data from a small sample of women. The objective of the present study was to reanalyse the relationship described by Forbes and to explore whether this relationship is consistent across ethnicity and sex groups using cross-sectional data from a large sample of white and African-American men and women. Baseline data from white and African-American men and women aged 18-60 years, who participated in a clinical study at the Pennington Biomedical Research Center since 2001 and who underwent dual-energy X-ray absorptiometry scans, were available for analysis. To overcome differences in BMI distributions among the ethnicity-by-sex groups, a stratified random sample of participants was selected within each group such that numbers in each BMI category ( < 25, 25-29·9, 30-34·9, 35-39·9, 40+ kg/m2) were proportional to those within the group with the smallest sample size, yielding a sample of 1953 individuals. Linear regression models assessed the FM-FFM relationship across the four ethnicity-by-sex groups. The FM-FFM relationship varied little by ethnicity (P = 0·57) or by sex (P = 0·26). The constant describing the FM-FFM relationship was estimated to be 9·7 (95 % CI 9·0, 10·3). In conclusion, results from our large, biethnic sample of men and women found a FM-FFM relationship very close to that originally described by Forbes, absent of significant variability by ethnicity or sex.
Conflict of interest statement
None of the authors has a conflict of interest.
Figures
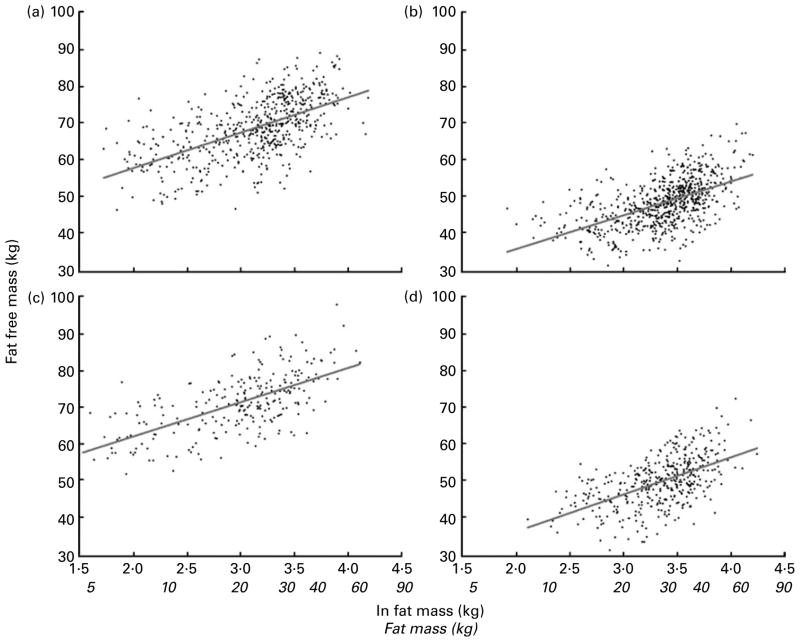
 ), by ethnicity and sex: (a) white men, b = 9·2; (b) white women, b = 9·7; (c) African-American men, b = 9·2; (d) African-American women, b = 10·4.
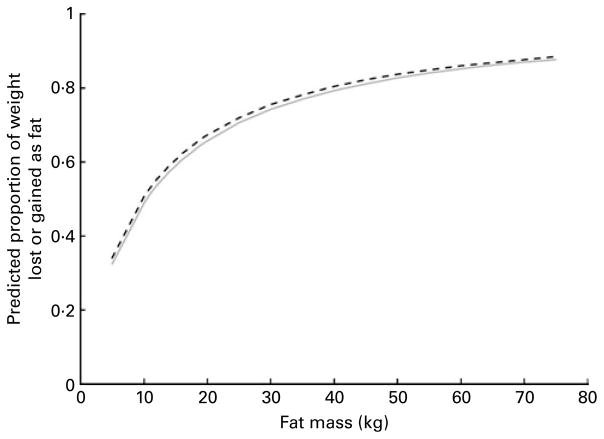
 Forbes’ model (C = 10·4); - - - Pennington Center Longitudinal Study model (C = 9·7).
Similar articles
-
Fat-free mass characteristics vary based on sex, race, and weight status in US adults.Nutr Res. 2020 Sep;81:58-70. doi: 10.1016/j.nutres.2020.07.002. Epub 2020 Jul 12. Nutr Res. 2020. PMID: 32882467
-
Ethnic and age-related fat free mass loss in older Americans: the Third National Health and Nutrition Examination Survey (NHANES III).BMC Public Health. 2005 Apr 19;5:41. doi: 10.1186/1471-2458-5-41. BMC Public Health. 2005. PMID: 15840167 Free PMC article.
-
Estimates of body composition with dual-energy X-ray absorptiometry in adults.Am J Clin Nutr. 2009 Dec;90(6):1457-65. doi: 10.3945/ajcn.2009.28141. Epub 2009 Oct 7. Am J Clin Nutr. 2009. PMID: 19812179
-
US pediatric population-level associations of DXA-measured percentage of body fat with four BMI metrics with cutoffs.Int J Obes (Lond). 2014 Jan;38(1):60-8. doi: 10.1038/ijo.2013.134. Epub 2013 Jul 26. Int J Obes (Lond). 2014. PMID: 23887060 Free PMC article.
-
Percentage of body fat cutoffs by sex, age, and race-ethnicity in the US adult population from NHANES 1999-2004.Am J Clin Nutr. 2012 Mar;95(3):594-602. doi: 10.3945/ajcn.111.025171. Epub 2012 Feb 1. Am J Clin Nutr. 2012. PMID: 22301924
Cited by
-
Why are there race/ethnic differences in adult body mass index-adiposity relationships? A quantitative critical review.Obes Rev. 2016 Mar;17(3):262-75. doi: 10.1111/obr.12358. Epub 2015 Dec 11. Obes Rev. 2016. PMID: 26663309 Free PMC article. Review.
-
A Pilot Study of Cardiorespiratory Fitness, Adiposity, and Cardiometabolic Health in Youth With Overweight and Obesity.Pediatr Exerc Sci. 2020 Apr 25;32(3):124-131. doi: 10.1123/pes.2019-0192. Pediatr Exerc Sci. 2020. PMID: 32335525 Free PMC article.
-
How well does the body adiposity index capture adiposity change in midlife women?: The SWAN fat patterning study.Am J Hum Biol. 2012 Nov-Dec;24(6):866-9. doi: 10.1002/ajhb.22330. Epub 2012 Sep 27. Am J Hum Biol. 2012. PMID: 23015468 Free PMC article.
-
Identification of skeletal muscle mass depletion across age and BMI groups in health and disease--there is need for a unified definition.Int J Obes (Lond). 2015 Mar;39(3):379-86. doi: 10.1038/ijo.2014.161. Epub 2014 Sep 1. Int J Obes (Lond). 2015. PMID: 25174451 Review.
-
How Strongly Does Appetite Counter Weight Loss? Quantification of the Feedback Control of Human Energy Intake.Obesity (Silver Spring). 2016 Nov;24(11):2289-2295. doi: 10.1002/oby.21653. Obesity (Silver Spring). 2016. PMID: 27804272 Free PMC article. Clinical Trial.
References
-
- Forbes GB. Lean body mass–body fat interrelationships in humans. Nutr Rev. 1987;45:225–231. - PubMed
-
- Forbes GB. Exercise and body composition. J Appl Physiol. 1991;70:994–997. - PubMed
-
- Forbes GB. Exercise and lean weight: the influence of body weight. Nutr Rev. 1992;50:157–161. - PubMed
-
- Forbes GB. Body fat content influences the body composition response to nutrition and exercise. Ann N Y Acad Sci. 2000;904:359–365. - PubMed
-
- Hall KD, Jordan PN. Modeling weight-loss maintenance to help prevent body weight regain. Am J Clin Nutr. 2008;88:1495–1503. - PubMed
Publication types
MeSH terms
Grants and funding
LinkOut - more resources
Full Text Sources
Other Literature Sources
Medical
