Comparative Study
. 2011 Mar;336(3):661-71.
doi: 10.1124/jpet.110.175679. Epub 2010 Dec 14.

Effect of phospholipidosis on the cellular pharmacokinetics of chloroquine

Affiliations
Comparative Study

Effect of phospholipidosis on the cellular pharmacokinetics of chloroquine

Nan Zheng et al. J Pharmacol Exp Ther. 2011 Mar.

Abstract

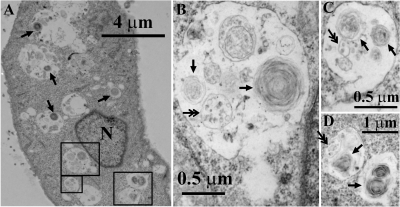
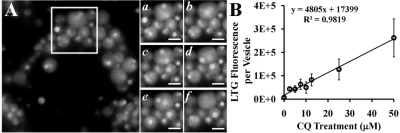
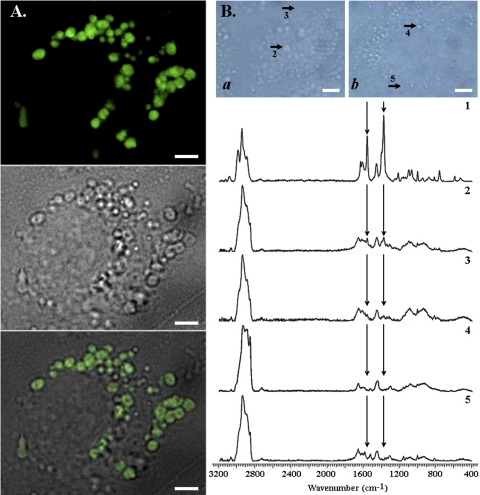
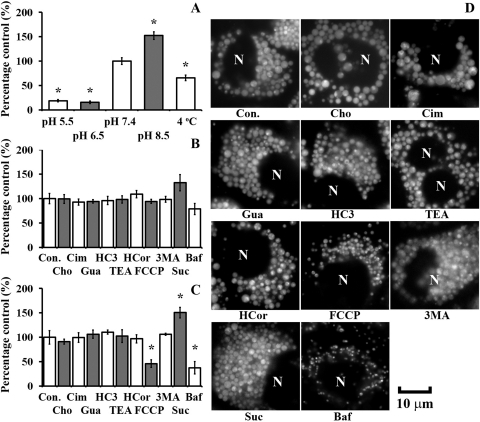
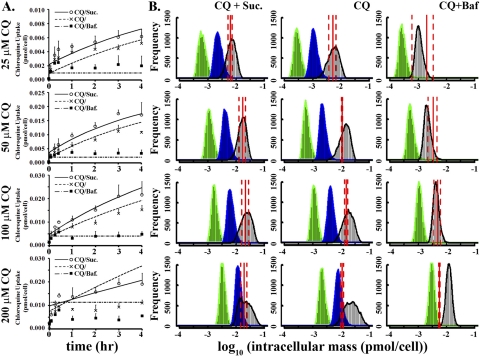
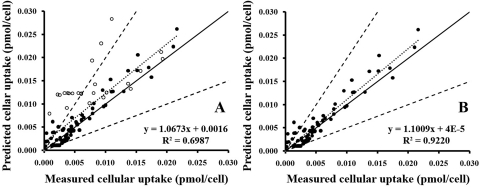
In vivo, the weakly basic, lipophilic drug chloroquine (CQ) accumulates in the kidney to concentrations more than a thousand-fold greater than those in plasma. To study the cellular pharmacokinetics of chloroquine in cells derived from the distal tubule, Madin-Darby canine kidney cells were incubated with CQ under various conditions. CQ progressively accumulated without exhibiting steady-state behavior. Experiments failed to yield evidence that known active transport mechanisms mediated CQ uptake at the plasma membrane. CQ induced a phospholipidosis-like phenotype, characterized by the appearance of numerous multivesicular and multilamellar bodies (MLBs/MVBs) within the lumen of expanded cytoplasmic vesicles. Other induced phenotypic changes including changes in the volume and pH of acidic organelles were measured, and the integrated effects of all these changes were computationally modeled to establish their impact on intracellular CQ mass accumulation. Based on the passive transport behavior of CQ, the measured phenotypic changes fully accounted for the continuous, nonsteady-state CQ accumulation kinetics. Consistent with the simulation results, Raman confocal microscopy of live cells confirmed that CQ became highly concentrated within induced, expanded cytoplasmic vesicles that contained multiple MLBs/MVBs. Progressive CQ accumulation was increased by sucrose, a compound that stimulated the phospholipidosis-like phenotype, and was decreased by bafilomycin A1, a compound that inhibited this phenotype. Thus, phospholipidosis-associated changes in organelle structure and intracellular membrane content can exert a major influence on the local bioaccumulation and biodistribution of drugs.


Figures

Fig. 1.
Fig. 1.
CQ induces a phospholipidosis-like phenotype characterized by the formation of many MLBs/MVBs in MDCK cells. MDCK cells were treated with 50 μM CQ for 4 h followed by transmission electron microscopy analysis. A–D, MDCK cells with enlarged vesicular compartments or MLBs/MVBs comprised of intraluminal MLBs (single arrows) or MVBs (double arrows). N, nucleus. Original magnification, 7900× (A), 34,000× (B and C), and 13,600× (D).
Fig. 2.
Fig. 2.
CQ-induced nonuniform distribution (A) and dose-dependent accumulation (B) of LTG within the LTG-positive vesicles in MDCK cells. A, at the end of a 4-h incubation with 50 μM CQ, LTG fluorescence within individual vesicles was concentrated within small particles of 0.3 to 0.4 μm in diameter, which underwent Brownian motion within the confines of the enlarged vesicles. These particles corresponded in shape and size to MLBs/MVBs observed by electron microscopy (Fig. 1). Images a to f were taken at 4-s intervals to show the Brownian movement of the bright MLBs/MVB particles within the lumen of the expanded vesicles. Scale bar, 2 μm. B, after a 4-h incubation with different amounts of CQ, the fluorescence volume intensity per vesicle increased with CQ treatment. Five cells (more than 300 vesicles) were measured under the same treatment.
Fig. 3.
Fig. 3.
CQ accumulates within enlarged MLB/MVB-positive vesicles. MDCK cells were treated with 10 μM CQ for 12 h, which primes them for vacuolar expansion and MLB/MVB formation, followed by 100 μM CQ for 2 h before imaging. For fluorescence microscopy, cells were incubated with 0.5 μM LTG for 30 min immediately before imaging. A, LTG fluorescence (top) and the corresponding brightfield image (middle) of a representative CQ-treated cell was merged (bottom), showing the highly heterogeneous LTG fluorescence associated with MLB/MVBs within the expanded cytoplasmic vesicles. Scale bar, 4 μm. B, analysis of intracellular CQ distribution by confocal Raman microscopy. Top, brightfield image showing 100 μM CQ-treated (a) and untreated (b) cells from which spectra were acquired. Scale bar, 5 μm. Bottom, spectrum 1 was acquired from 100 mM CQ solution in buffer, as reference. Spectra 2 and 3 were acquired from the vesicles and cytosol of treated cells, respectively; spectra 4 and 5 were acquired from the vesicles and cytosol of untreated cells. In these spectra, CQ-specific Raman vibrational peaks (around wavenumbers 1370 and 1560) were identified on the basis of spectrum 1. The CQ-specific Raman signal was mostly localized within the expanded vesicles of CQ-treated cells.
Fig. 4.
Fig. 4.
Temperature- and pH-dependent CQ uptake parallels the induced phospholipidosis effect and is insensitive to pharmacological inhibitors of organic cation transport. A, within 30 min CQ uptake (50 μM) into MDCK cells was significantly reduced by lowering extracellular pH and lowering the temperature. Uptake experiments were performed in transport buffer. Control experiments were performed at pH 7.4 and 37°C. B, within 30 min of incubation, CQ uptake (50 μM) and cellular vacuolation were not significantly perturbed by inhibitors of autophagy or active transport. Preincubation with 0.1 M sucrose in DMEM increased CQ uptake within 30 min, whereas cotreatment with bafilomycin A1 inhibited CQ uptake, but the difference was not significant. Uptake experiments were performed in choline-based transport buffer (Cho) and DMEM (all the other conditions). C and D, at the end of a 4-h incubation, CQ uptake and LTG-positive vesicular expansion were partially inhibited by FCCP, significantly suppressed by bafilomycin A1, but not reduced by the OCT inhibitor/stimulator, the autophagy inhibitor 3MA, or the sodium-free extracellular buffer. Con., control, 50 μM CQ only; Cho, 50 μM CQ in choline-based transport buffer; Cim, 500 μM cimetidine; HC3, 500 μM hemicholinium-3; Gua, 500 μM guanidine; TEA, 500 μM tetraethylammonium; HCor, 20 μM hydrocortisone; FCCP, 5 μM FCCP; 3MA, 10 mg/ml 3-methyladenine; Suc, 0.1 M sucrose; Baf, 10 nM bafilomycin A1. Data are presented as the mean ± S.E.M from three experiments. *, significant difference from control using an unpaired Student's t test (p < 0.05). N, nucleus. Scale bar, 10 μm.
Fig. 5.
Fig. 5.
Quantitative analysis and mechanism-based, predictive pharmacokinetic modeling of CQ uptake in MDCK cells. A, measured uptake kinetics during 1) 25, 50, 100, and 200 μM CQ treatments in previously untreated cells (CQ/); 2) Suc-pretreated cells during cotreatment with CQ and sucrose (CQ/Suc); and 3) cotreatment with CQ and Baf in previously untreated cells (CQ/Baf). Data points correspond to the mean ± S.E.M. (n = 3). B, histograms of Monte Carlo simulations of intracellular CQ accumulation in relation to experimental CQ mass accumulation. A total of 10,000 simulations were performed with parameters randomly selected from a range (Supplemental Table S1). Red solid lines correspond to the measured, average CQ mass per cell at the end of a 4-h incubation with 25, 50, 100, and 200 μM CQ (red dashed lines represent ± S.E.M.). Green indicates simulation results in the absence of phenotypic changes. Blue indicates simulation results incorporating volume changes of organelles but without partitioning to MLB/MVBs. Black indicates simulation results incorporating volume changes in acidic organelles, as well as CQ partitioning to MLBs/MVBs.
Fig. 6.
Fig. 6.
Assessing the performance of the cellular pharmacokinetic model. The predicted intracellular mass was plotted against the measured values at eight time points for four levels of CQ treatment with (or without) sucrose or bafilomycin A1. ——, the unity line; – – –, factor of 2 on both sides of the unity line; · · · · ·, the best fit with the equation displayed. ●, data from 25, 50, and 100 μM CQ treatments; ○, data from 200 μM CQ treatments. A, analysis of measurements from 25, 50, 100, and 200 μM CQ treatments. B, analysis of measurements from 25, 50, and 100 μM CQ treatments.

References

    1. Bawolak MT, Morissette G, Marceau F. (2010) Vacuolar ATPase-mediated sequestration of local anesthetics in swollen macroautophagosomes. Can J Anaesth 57:230–239 - PubMed
    1. Bergqvist Y, Hed C, Funding L, Suther A. (1985) Determination of chloroquine and its metabolites in urine: a field method based on ion-pair extraction. Bull World Health Organ 63:893–898 - PMC - PubMed
    1. de Duve C, de Barsy T, Poole B, Trouet A, Tulkens P, Van Hoof F. (1974) Commentary. Lysosomotropic agents. Biochem Pharmacol 23:2495–2531 - PubMed
    1. Djordevic B, Lange CS, Rotman M. (1992) Potentiation of radiation lethality in mouse melanoma cells by mild hyperthermia and chloroquine. Melanoma Res 2:321–326 - PubMed
    1. Ducharme J, Farinotti R. (1996) Clinical pharmacokinetics and metabolism of chloroquine. Focus on recent advancements. Clin Pharmacokinet 31:257–274 - PubMed

Publication types

LinkOut - more resources