. 2011 Feb 24;43(4):199-212.
doi: 10.1152/physiolgenomics.00217.2010. Epub 2010 Dec 14.

Exercise, weight loss, and changes in body composition in mice: phenotypic relationships and genetic architecture

Affiliations

Exercise, weight loss, and changes in body composition in mice: phenotypic relationships and genetic architecture

Scott A Kelly et al. Physiol Genomics. .

Abstract

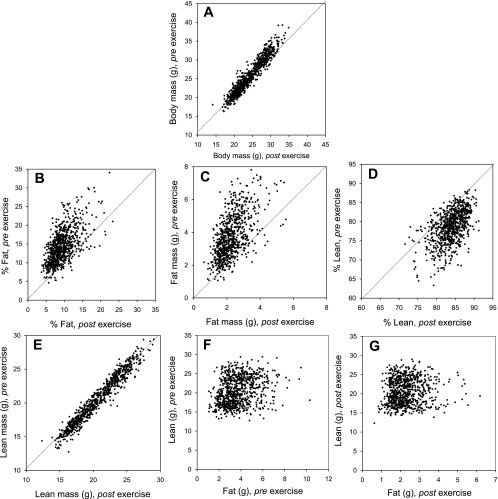
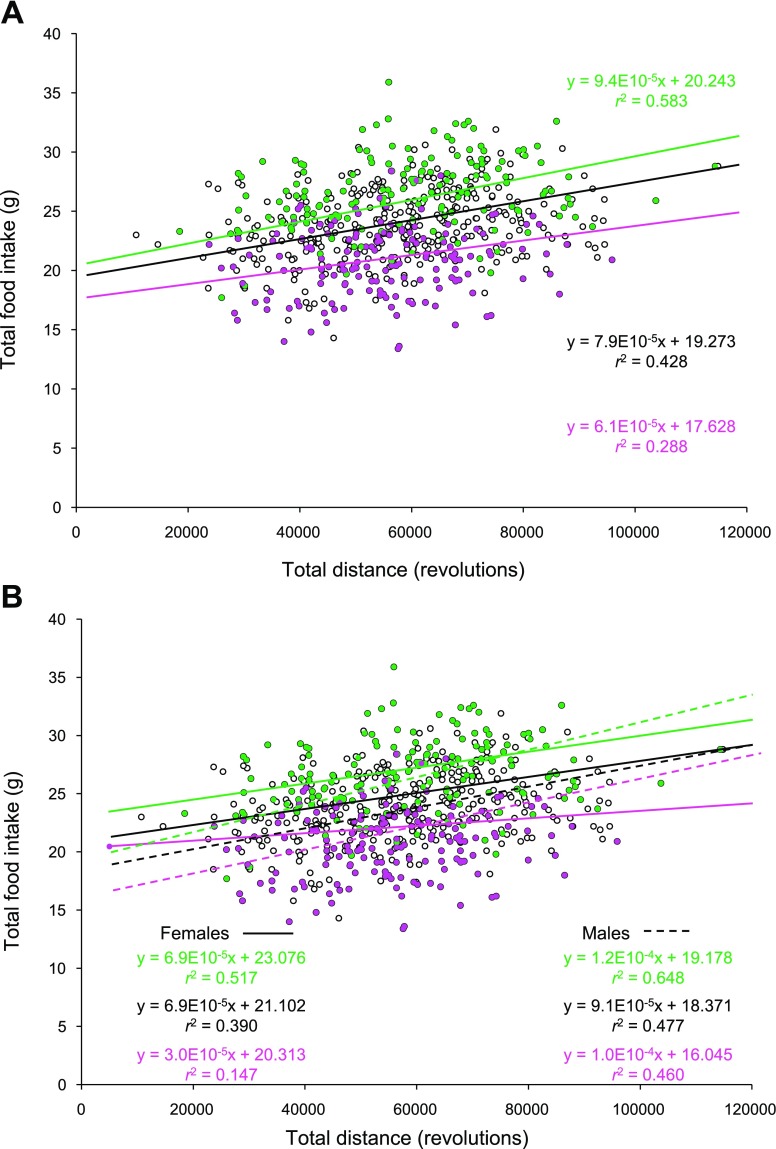
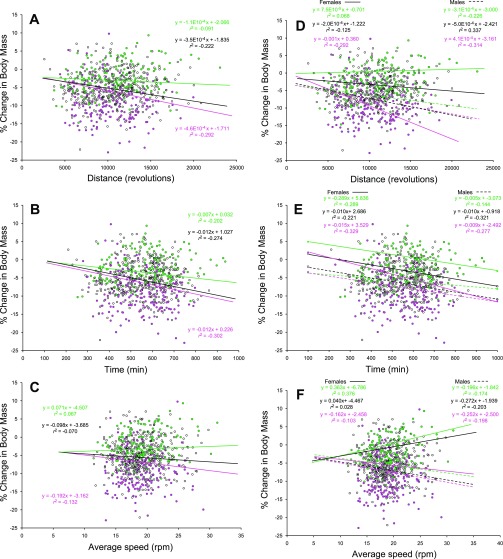
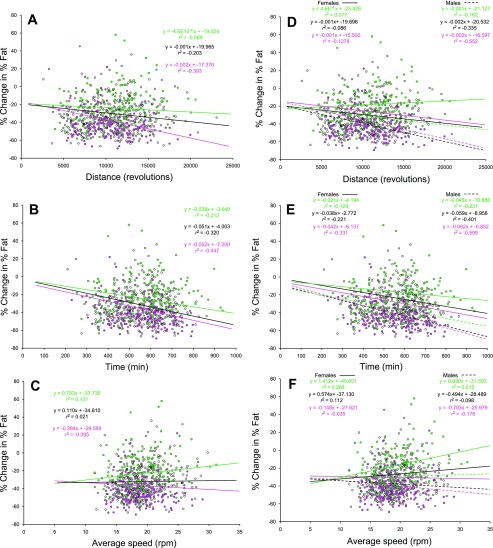
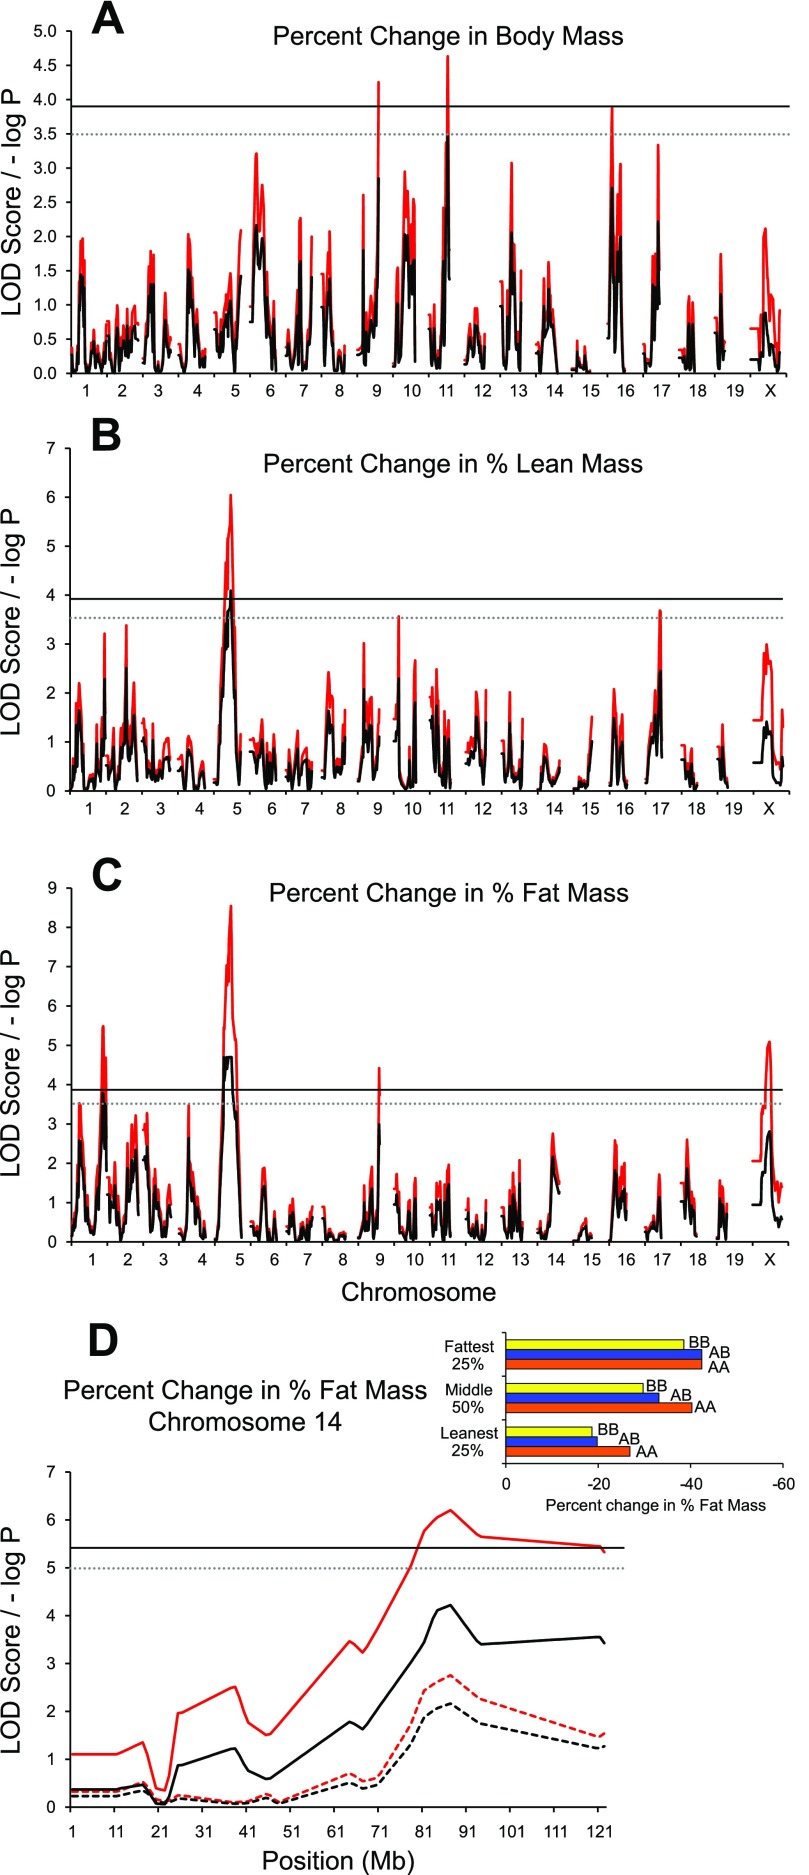
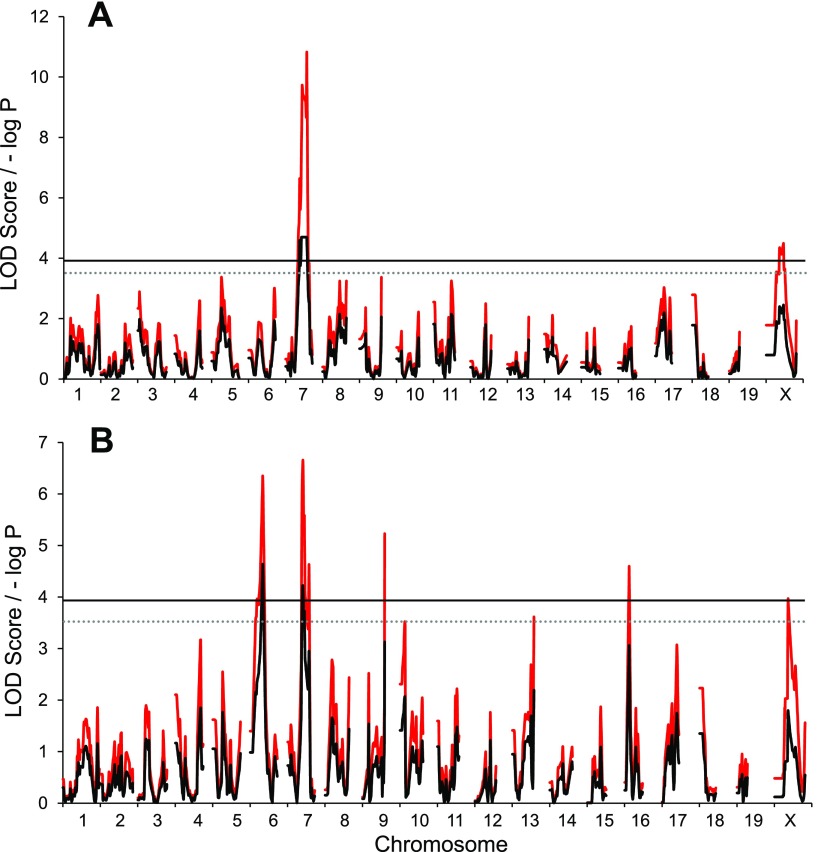
The regulation of body weight and composition is complex, simultaneously affected by genetic architecture, the environment, and their interactions. We sought to analyze the complex phenotypic relationships between voluntary exercise, food consumption, and changes in body weight and composition and simultaneously localize quantitative trait loci (QTL) controlling these traits. A large (n = 815) murine advanced intercross line (G(4)) was created from a reciprocal cross between a high-running line and the inbred strain C57BL/6J. Body weight and composition (% fat, % lean) were measured at 4, 6, and 8 wk of age. After measurements at 8 wk of age, mice were given access to running wheels, during which food consumption was quantified and after which body weight and composition were assessed to evaluate exercise-induced changes. Phenotypic correlations indicated that the relationship between exercise and overall change in weight and adiposity depended on body composition before the initiation of exercise. Interval mapping revealed QTL for body weight, % fat, and % lean at 4, 6, and 8 wk of age. Furthermore, QTL were observed for food consumption and changes in weight, % fat, and % lean in response to short-term exercise. Here we provide some clarity for the relationship between weight loss, reduction in adiposity, food consumption, and exercise. Simultaneously, we reinforce the genetic basis for body weight and composition with some independent loci controlling growth at different ages. Finally, we present unique QTL providing insight regarding variation in weight loss and reduction in adiposity in response to exercise.


Figures

Fig. 1.
Fig. 1.
Body composition measures before (Pre) and after (Post) 6 days of voluntary wheel running. A: body mass (g). B: % fat. C: fat mass (g). D: % lean. E: lean mass (g). F: lean vs. fat (Pre exercise). G: lean vs. fat (Post exercise). The dotted line represents a 1-to-1 relation and demonstrates that 6 days of wheel access consistently reduced body mass (paired t-test, P < 0.001), reduced % body fat (paired t-test, P < 0.001), and increased % lean mass (paired t-test, P < 0.0001).
Fig. 2.
Fig. 2.
A: regression analyses between total food consumption and total running distance during the 6-day wheel exposure for the entire population (black), the 25% leanest Pre wheel access (green), and the 25% fattest Pre wheel access (pink). B: sex-specific results; the dashed regression lines characterize the females in each of 3 subpopulations, while the solid lines represent the males. Conditional slopes and r2 were controlled for sex, parent of origin, and mean fat and lean mass [(Pre exercise + Post exercise)/2]. Running wheel circumference was 1.1 m.
Fig. 3.
Fig. 3.
Regression analyses between % change in body mass [(Post − Pre)/Pre] × 100 and exercise. Values for the entire population (black), the leanest 25% (green), and the fattest 25% (pink) (based on Pre exercise values) are shown. Exercise traits were mean running distance (revolutions/day), duration (i.e., cumulative 1-min intervals in which at least 1 revolution was recorded), and average speed (total revolutions/time spent running) on days 5 and 6 of a 6-day test. In A–C the sexes are pooled in each of the 3 groups, while in D–F the regression results are sex specific (dashed line denotes females, solid line denotes males). Conditional slopes and r2 were controlled for sex, parent of origin, and food consumption. Individuals with a positive % change gained mass as a result of 6 days of wheel access. Running wheel circumference was 1.1 m.
Fig. 4.
Fig. 4.
Regression analyses between % change [(Post − Pre)/Pre] × 100 in % fat mass and mean running traits on days 5 and 6 of a 6-day test. Running distance (revolutions/day), duration (i.e., cumulative 1-min intervals in which at least 1 revolution was recorded), and average speed (total revolutions/time spent running) for the entire population (black), the leanest 25% (green), and the fattest 25% (pink) are shown. In A–C the sexes are pooled in each of the 3 groups, while in D–F the regression results are sex specific (dashed line denotes females, solid line denotes males). Conditional slopes and r2 were controlled for sex, parent of origin, and food consumption. Individuals with a positive % change in % mass increased adiposity as a result of 6 days of wheel access. Running wheel circumference was 1.1 m.
Fig. 5.
Fig. 5.
G4 quantitative trait locus (QTL) maps of % change [(Post − Pre)/Pre] × 100 in body composition following exercise. A: body mass. B: % lean mass. C: % fat mass as a result of 6 days of running wheel exposure. Red traces are the simple mapping output, and black traces are Genome Reshuffling for Advanced Intercross Permutation (GRAIP) permutation output. The solid and dotted lines represent the permuted 95% [logarithm of odds (LOD) ≥ 3.9, P ≤ 0.05] and 90% (LOD ≥ 3.5, P ≤ 0.1) LOD thresholds, respectively. D: follow-up analysis of results illustrated in C, depicting a QTL × group (Pre exercise; leanest 25%, middle 50%, fattest 25%) interaction. Dashed lines represent analysis without interaction term in the model.
Fig. 6.
Fig. 6.
G4 QTL map of food consumption independent of body mass (A) and per gram of body mass (B) for the entire 6-day wheel access period. Red traces are the simple mapping output, and black traces are GRAIP permutation output. Solid and dotted lines represent the permuted 95% (LOD ≥ 3.9, P ≤ 0.05) and 90% (LOD ≥ 3.5, P ≤ 0.1) LOD thresholds, respectively.

References

    1. Allan MF, Eisen EJ, Pomp D. Genomic mapping of direct and correlated responses to long-term selection for rapid growth rate in mice. Genetics 170: 1863–1877, 2005. - PMC - PubMed
    1. Blundell JE, Stubbs RJ, Hughes DA, Whybrow S, King NA. Cross talk between physical activity and appetite control: does physical activity stimulate appetite? Proc Nutr Soc 62: 651–661, 2003. - PubMed
    1. Bouchard C, Tremblay A, Nadeau A, Dussault J, Despres JP, Theriault G, Lupien PJ, Serresse O, Boulay MR, Fournier G. Long-term exercise training with constant energy intake. 1. Effect on body composition and selected metabolic variables. Int J Obes 14: 57–73, 1990. - PubMed
    1. Bray MS, Hagberg JM, Perusse L, Rankinen T, Roth SM, Wolfarth B, Bouchard C. The human gene map for performance and health related fitness phenotypes: the 2006–2007 update. Med Sci Sports Exerc 41: 34–42, 2009. - PubMed
    1. Broman KW, Wu H, Sen S, Churchill GA. R/qtl: QTL mapping in experimental crosses. Bioinformatics 19: 889–890, 2003. - PubMed

Publication types