. 2010 Nov;37(11):5801-10.
doi: 10.1118/1.3501881.

Flow measurement in MRI using arterial spin labeling with cumulative readout pulses--theory and validation

Affiliations

Flow measurement in MRI using arterial spin labeling with cumulative readout pulses--theory and validation

Yi Wang et al. Med Phys. 2010 Nov.

Abstract

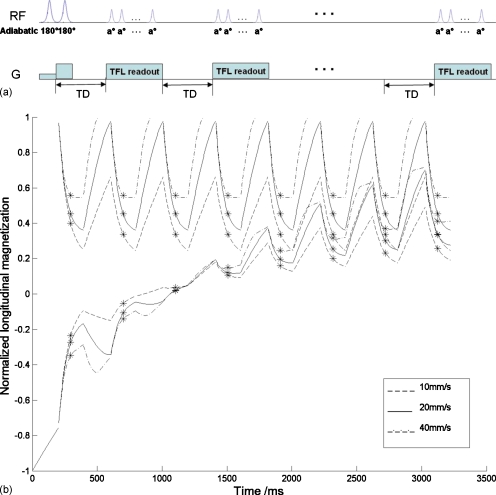
Purpose: This article systematically examines arterial spin labeling (ASL) as a flow quantification technique through theoretical simulation, in vitro, and in vivo experiment. The authors present a novel imaging pulse sequence design consisting of a single ASL magnetization preparation followed by Look-Locker-like image readouts. Bloch-equation-based modeling has been developed and validated using a hemodialyzer as a tissue-mimicking flow phantom.

Methods: After the single in-plane slice-selective double inversion magnetization preparation, multiple TFL readouts are acquired with linear k-space ordering, causing a signal variation that depends on through-slice flow velocity. Computer simulations were performed to assess the behavior of the flow-dependent ASL signal as a function of varying imaging parameters. The signal was optimized by choosing imaging parameters that maximize the simulated flow-sensitive signal. Furthermore, a hemodialyzer which mimics blood flow in human tissues was tested with a wide range of flow rates. An exponential curve fitting of the flow-sensitive dynamics to the model derived from Bloch equations provides a method to estimate through-slice velocity for varying flow rates on the hemodialyzer and in vivo human brain.

Results: The flow dependency of the ASL signal and the sensitivity of the ASL signal to imaging parameters were demonstrated. Experimental results from a hemodialyzer when fitted with a Bloch-equation-based model provide flow measurements that are consistent with ground truth velocities. Human brain velocity mapping was obtained as well.

Conclusions: The results provide evidence that the proposed pulse sequence design is an effective technique to measure total fluid flow through image voxels. The unique combination of the two main features, multiple-image readout after a single ASL preparation and linear acquisition ordering in the phase encoding direction in TFL imaging, make this technique an appealing flow imaging method to quantify through-plane flow in a time-efficient manner.


Figures

Figure 1
Figure 1
Schematic diagrams of the tagging imaging pulse sequence along with the evolution of the longitudinal magnetization of tag and control inflowing fluid. (a) IDOL tagging inversion is followed by a series of TFL image readouts. Depending on the fluid (blood) T1, TD and the number of images acquired along the curve can be adjusted. (b) Longitudinal magnetization of tag (bottom lines) and control (top lines) inflowing fluid. With the simulation parameters imaging slice thickness=5 mm, TD=200 ms, T1=1450 ms, and flip angle=15°, fast flow 40 mm∕s (dashed-dotted line) guarantees the initial magnetization originates from the inversion recovery curve, whereas the initial magnetization of slow flow 10 mm/s (dashed line) must incorporate the signal evolution from previous readouts. For these parameters, 20 mm/s (solid line) seems to be the critical velocity below which the impact of preceding readout pulses needs to be taken into account. Eight images were simulated after single ASL preparation. A marker is indicated at the point where the signal from the center of k-space is acquired with linear phase encoding ordering.
Figure 2
Figure 2
Evolution of longitudinal magnetization for tagging (bottom lines) and control (top lines) scans, respectively. The simulation parameters were TR=3 ms, α=15°, TD=200 ms, Ny=64, T1=1.45 s, slice thickness=5 mm, matrix size=64×64, and number of images along the curve=8. At each TI, three velocities [20, 40, 60] mm∕s were simulated. The case with highest velocity stays closest to the main magnetization curve, while the flow with the lowest velocity deviates further away from the main magnetization curve. It is assumed that the lowest velocity being fast enough that each time the imaging starts with freshly inflowing spins.
Figure 3
Figure 3
Simulation of normalized flow-sensitive signals at an extrafiber velocity of (a) 40 and (b) 120 mm∕s. The maximum flow signal is achieved at α of 10° and 15°, respectively. The rest of the parameters were kept the same as in Fig. 2. At different flow velocities, α can be adjusted to obtain the maximum flow-sensitive signal.
Figure 4
Figure 4
Simulated flow-sensitive signals as a function of fluid spin-lattice relaxation time T1=[1000, 1500, 2000, 2500] ms. Using the same parameters, maximum flow-sensitive signal for an extrafiber flow velocity of 40, α=10° is achieved at T1 of 1450 ms.
Figure 5
Figure 5
Representative eight single-slice images acquired at [200, 600, 1000, 1400, 1800, 2200, 2600, 3000] ms after the ASL magnetization inversion with a pumping rate of 200 cc∕min. Three rows correspond to tag (upper row), control (middle row), and difference (lower row) images. Within each image, cross-sections of a Siemens water phantom (biggest cross-section), the hemodialyzer (arrow head), and the thin tube (arrow) are depicted. Static water signals cancel out completely in the flow-sensitive difference images. The dialyzer signal cancels in the first image because it took longer than 200 ms for the tagged flow to enter the imaged slice.
Figure 6
Figure 6
Comparison of simulated ASL signal (dashed lines) and experimental results (solid lines). Experimental flow-sensitive signals were averaged over the cross-sections of hemodialyzer at four pumping rates [45, 90, 135, 180] cc∕min at a TD of 200 ms and α of 15°. Simulated flow-sensitive signal is calculated as the difference of control and tagging signal (see Fig. 2) using the same parameters as in the experiment. Overall, there is a reasonably good agreement between the two and the only discrepancy lies in the initial signal increment which is due to the incomplete inflow of tagged spins.
Figure 7
Figure 7
Curve fittings at four pumping rates [45, 90, 135, 180] cc∕min from two-compartment fitting. The resulting averaged velocities are [1.59, 3.57, 5.69, 7.36] mm∕s, respectively. The calculated correlation coefficient between the data and the fitting does decrease as the flow rates decrease.
Figure 8
Figure 8
Representative coronal single-slice images acquired at [500, 1000, 1500, 2000, 2500, 3000, 5000] ms after the ASL magnetization inversion at a pumping rate of 180 cc∕min. Three rows correspond to tag (upper row), control (middle row), and difference (lower row) images. Within each image, coronal views of a Siemens water phantom (largest area), the hemodialyzer (arrow head), and the thin tube (arrow) are depicted. The progression of the front edge of fluid in hemodialyzer as TI increases (dashed line) provides a way to estimate the flow velocity, as presented by the dotted line.
Figure 9
Figure 9
Flow-sensitive images acquired at TI of [700, 1000, 1300, 1600, 1900, 2200] ms. Bolus wash-out is visible as TI increases. The superior sagittal sinus located at the bottom (circle) appears bright because the venous blood is labeled in IDOL tagging schemes.
Figure 10
Figure 10
Brain velocity mapping (unit: mm∕s). A high velocity is found in the superior sagittal sinus and slower velocities can be seen in gray matter.

References

    1. Williams D. S. et al., “Magnetic resonance imaging of perfusion using spin inversion of arterial water,” Proc. Natl. Acad. Sci. U.S.A. PNASA6 89(1), 212–216 (1992).10.1073/pnas.89.1.212 - DOI - PMC - PubMed
    1. Song C. W., Rhee J. G., and Levitt S. H., “Blood flow in normal tissues and tumors during hyperthermia,” J. Natl. Cancer Inst. JNCIEQ 64(1), 119–124 (1980). - PubMed
    1. Wu F. et al., “Tumor vessel destruction resulting from high-intensity focused ultrasound in patients with solid malignancies,” Ultrasound Med. Biol. USMBA3 28(4), 535–542 (2002).10.1016/S0301-5629(01)00515-4 - DOI - PubMed
    1. Detre J. A. et al., “Perfusion imaging,” Magn. Reson. Med. MRMEEN 23(1), 37–45 (1992).10.1002/mrm.1910230106 - DOI - PubMed
    1. Buxton R. B. et al., “A general kinetic model for quantitative perfusion imaging with arterial spin labeling,” Magn. Reson. Med. MRMEEN 40(3), 383–396 (1998).10.1002/mrm.1910400308 - DOI - PubMed

Publication types