. 2010 Nov;37(11):5811-20.
doi: 10.1118/1.3504605.

Thoracic target volume delineation using various maximum-intensity projection computed tomography image sets for radiotherapy treatment planning

Affiliations

Thoracic target volume delineation using various maximum-intensity projection computed tomography image sets for radiotherapy treatment planning

David A Zamora et al. Med Phys. 2010 Nov.

Abstract

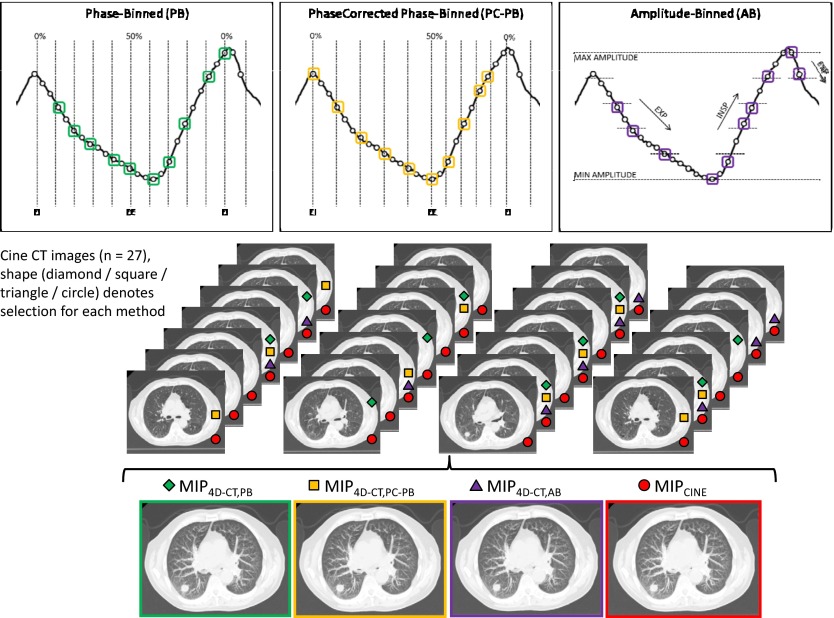
Purpose: Four-dimensional computed tomography (4D-CT) is commonly used to account for respiratory motion of target volumes in radiotherapy to the thorax. From the 4D-CT acquisition, a maximum-intensity projection (MIP) image set can be created and used to help define the tumor motion envelope or the internal gross tumor volume (iGTV). The purpose of this study was to quantify the differences in automatically contoured target volumes for usage in the delivery of stereotactic body radiation therapy using MIP data sets generated from one of the four methods: (1) 4D-CT phase-binned (PB) based on retrospective phase calculations, (2) 4D-CT phase-corrected phase-binned (PC-PB) based on motion extrema, (3) 4D-CT amplitude-binned (AB), and (4) cine CT built from all available images.

Methods: MIP image data sets using each of the four methods were generated for a cohort of 28 patients who had prior thoracic 4D-CT scans that exhibited lung tumor motion of at least 1 cm. Each MIP image set was automatically contoured on commercial radiation treatment planning system. Margins were added to the iGTV to observe differences in the final simulated planning target volumes (PTVs).

Results: For all patients, the iGTV measured on the MIP generated from the entire cine CT data set (iGTVcine) was the largest. Expressed as a percentage of iGTVcine, 4D-CT iGTV (all sorting methods) ranged from 83.8% to 99.1%, representing differences in the absolute volume ranging from 0.02 to 4.20 cm3; the largest average and range of 4D-CT iGTV measurements was from the PC-PB data set. Expressed as a percentage of PTVcine (expansions applied to iGTVeine), the 4D-CT PTV ranged from 87.6% to 99.6%, representing differences in the absolute volume ranging from 0.08 to 7.42 cm3. Regions of the measured respiratory waveform corresponding to a rapid change of phase or amplitude showed an increased susceptibility to the selection of identical images for adjacent bins. Duplicate image selection was most common in the AB implementation, followed by the PC-PB method. The authors also found that the image associated with the minimum amplitude measurement did not always correlate with the image that showed maximum tumor motion extent.

Conclusions: The authors identified cases in which the MIP generated from a 4D-CT sorting process under-represented the iGTV by more than 10% or up to 4.2 cm3 when compared to the iGTVcine. They suggest utilization of a MIP generated from the full cine CT data set to ensure maximum inclusive tumor extent.


Figures

Figure 1
Figure 1
MIP images generated from one of the three 4D-CT sorting processes (PB, PC-PB, and AB) or from the use of all 27 cine CT images. Top: Respiratory signal at a single bed position on a representative patient case showing that the same input will lead to the selection of a different distribution of ten images for each different sorting method (bottom). Each of the three MIP4D-CT image sets is generated from the selected images.
Figure 2
Figure 2
Histogram of iGTV4D-CT as a percent of iGTVcine for each of the 4D-CT sorting methods. The PC-PB method had the largest average result, but also exhibited the largest range of values. The AB method resulted in the smallest average iGTV4D-CT as a percentage of iGTVcine for our patient population.
Figure 3
Figure 3
Clinical example of breathing cycles and their associated cine CT image midscan times. White circles on the waveform indicate an available cine CT image from a single bed position. A single box indicates that cine CT image was selected by the PC-PB method (left) or the AB method (right). Multiple boxes indicate that a particular cine CT image was selected multiple times for adjacent bins. A particularly short inhalation period or steep amplitude measurement (high time rate of change of amplitude either during inhalation or during exhalation) led to a higher likelihood of duplicate image selection with PC-PB and AB sorting.
Figure 4
Figure 4
Distribution of adjacent bin pairs that included duplicate images for each of the three 4D-CT sorting processes. This distribution was used to identify what portion of the breathing cycle was most susceptible to duplicate image selection for each method. For PC-PB, duplicate image selection occurs predominantly during the temporally shorter inspiration. For AB, two distinct regions of duplication occur during the steep inhalation and exhalation portions of the respiratory waveform.
Figure 5
Figure 5
Top: Clinical example of (left) a breathing cycle with boxed AB selections and (right) of the mismatch between the image at minimum amplitude (d) and visualization of maximum tumor motion [(b) or (c)]. Image (a) shows the tumor starting to move into the image plane as the patient exhales. Image (c), occurring 0.3 s prior to the minimum RPM amplitude image, has the highest tumor visibility and density. Image (d), associated with the extreme-amplitude measurement, exhibits suppressed density and blurred visualization.
Figure 6
Figure 6
Left: Temporal window of the image at minimum amplitude overlaid on the respiratory waveform for the clinical case presented in Fig. 5. The temporal window captures a large portion of the inhalation phase, causing the blurry appearance of image (d). Right: Contouring shows that the MIP4D-CT,PB (left) and MIP4D-CT,PC-PB (center) exhibit close agreement with the outermost contour from the MIPcine. MIP4D-CT,AB (right) does not exhibit full visualization of the superior portion of tumor motion envelope when compared to the outermost MIPcine contour.

References

    1. Mayo J. R., Muller N. L., and Henkelman R. M., “The double-fissure sign: A motion artifact on thin-section CT scans,” Radiology RADLAX 165, 580–581 (1987). - PubMed
    1. Crawford C. R., King K. F., Ritchie C. J., and Godwin J. D., “Respiratory compensation in projection imaging using a magnification and displacement model,” IEEE Trans. Med. Imaging ITMID4 15, 327–332 (1996).10.1109/42.500141 - DOI - PubMed
    1. Balter J. M., Ten Haken R. K., Lawrence T. S., Lam K. L., and Robertson J. M., “Uncertainties in CT-based radiation therapy treatment planning associated with patient breathing,” Int. J. Radiat. Oncol., Biol., Phys. IOBPD3 36, 167–174 (1996).10.1016/S0360-3016(96)00275-1 - DOI - PubMed
    1. Keall P. J., Mageras G. S., Balter J. M., Emery R. S., Forster K. M., Jiang S. B., Kapatoes J. M., Low D. A., Murphy M. J., Murray B. R., Ramsey C. R., Van Herk M. B., Vedam S. S., Wong J. W., and Yorke E., “The management of respiratory motion in radiation oncology report of AAPM Task Group 76,” Med. Phys. MPHYA6 33, 3874–3900 (2006).10.1118/1.2349696 - DOI - PubMed
    1. Keall P. J., Kini V. R., Vedam S. S., and Mohan R., “Potential radiotherapy improvements with respiratory gating,” Australas. Phys. Eng. Sci. Med. AUPMDI 25, 1–6 (2002).10.1007/BF03178368 - DOI - PubMed