. 2010 Nov;37(11):5858-66.
doi: 10.1118/1.3504609.

Investigation of an implantable dosimeter for single-point water equivalent path length verification in proton therapy

Affiliations

Investigation of an implantable dosimeter for single-point water equivalent path length verification in proton therapy

Hsiao-Ming Lu et al. Med Phys. 2010 Nov.

Abstract

Purpose: In vivo range verification in proton therapy is highly desirable. A recent study suggested that it was feasible to use point dose measurement for in vivo beam range verification in proton therapy, provided that the spread-out Bragg peak dose distribution is delivered in a different and rather unconventional manner. In this work, the authors investigate the possibility of using a commercial implantable dosimeter with wireless reading for this particular application.

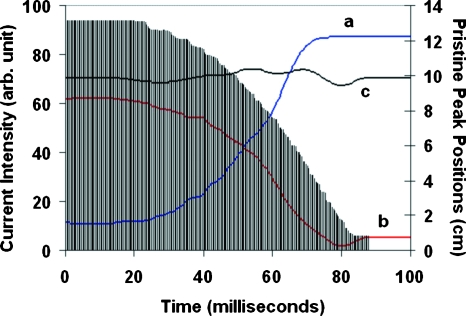
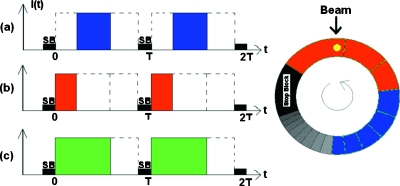
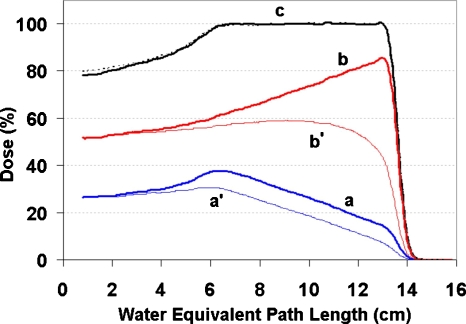
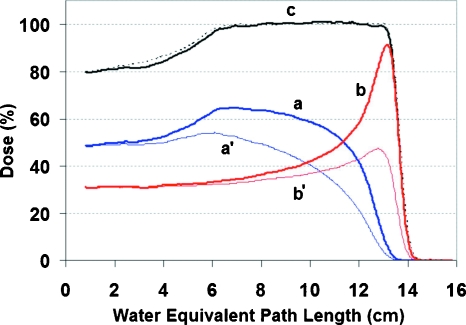
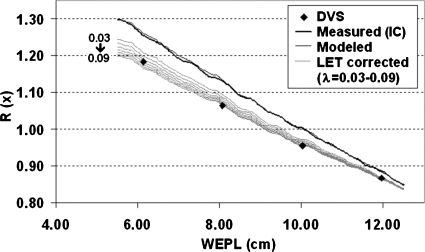
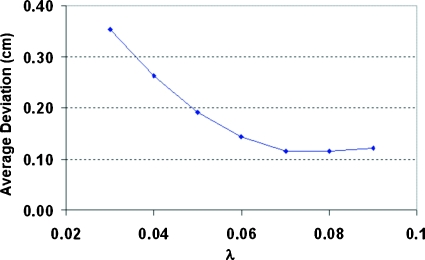
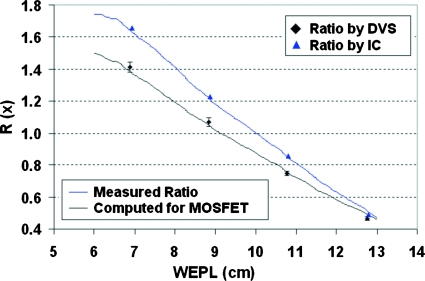
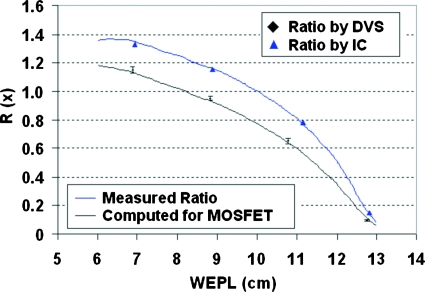
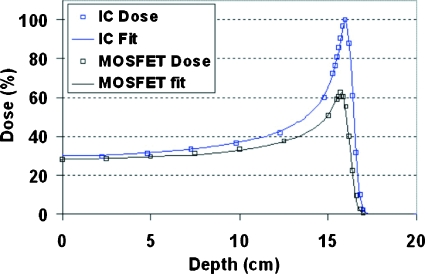
Methods: The traditional proton treatment technique delivers all the Bragg peaks required for a SOBP field in a single sequence, producing a constant dose plateau across the target volume. As a result, a point dose measurement anywhere in the target volume will produce the same value, thus providing no information regarding the water equivalent path length to the point of measurement. However, the same constant dose distribution can be achieved by splitting the field into a complementary pair of subfields, producing two oppositely "sloped" depth-dose distributions, respectively. The ratio between the two distributions can be a sensitive function of depth and measuring this ratio at a point inside the target volume can provide the water equivalent path length to the dosimeter location. Two types of field splits were used in the experiment, one achieved by the technique of beam current modulation and the other by manipulating the location and width of the beam pulse relative to the range modulator track. Eight MOSFET-based implantable dosimeters at four different depths in a water tank were used to measure the dose ratios for these field pairs. A method was developed to correct the effect of the well-known LET dependence of the MOSFET detectors on the depth-dose distributions using the columnar recombination model. The LET-corrected dose ratios were used to derive the water equivalent path lengths to the dosimeter locations to be compared to physical measurements.

Results: The implantable dosimeters measured the dose ratios with a reasonable relative uncertainty of 1%-3% at all depths, except when the ratio itself becomes very small. In total, 55% of the individual measurements reproduced the water equivalent path lengths to the dosimeters within 1 mm. For three dosimeters, the difference was consistently less than 1 mm. Half of the standard deviations over the repeated measurements were equal or less than 1 mm.

Conclusions: With a single fitting parameter, the LET-correction method worked remarkably well for the MOSFET detectors. The overall results were very encouraging for a potential method of in vivo beam range verification with millimeter accuracy. This is sufficient accuracy to expand range of clinical applications in which the authors could use the distal fall off of the proton depth dose for tight margins.


Figures

Figure 1
Figure 1
Beam current modulation patterns required to generate a type I field pair, (a) for a depth-dose distribution sloping down distally, (b) for sloping up, and (c) for a typical SOBP field with a constant dose plateau. The histogram shows the peak position of the depth-dose distribution corresponding to each rotational position of the modulator wheel over the full period of rotation (100 ms).
Figure 2
Figure 2
A schematic illustration of the method for generating a type II field pair. The three beam pulse patterns differ in location and width, (a) covering only the lower right section of the modulator track, (b) the upper section, and (c) the sum of (a) and (b), covering both as in a conventional dose delivery. T is the rotational period of the modulator track and SB marks the position of the stop block.
Figure 3
Figure 3
Depth doses for the type I field pair used in the experiment. The distributions (a) and (b) correspond to the beam current modulation patterns (a) and (b) in Fig. 1 and were measured with a Markus chamber. They were scaled in the figure such that their sum has a constant dose plateau (c) as by a conventional dose delivery. The distributions (a) and (b) were computed with the LET correction based on the time-resolved data obtained in measuring (a) and (b). The depth-dose measured without splitting the field delivery is shown in the dotted line.
Figure 4
Figure 4
Depth doses for the type II field pair used in the experiment. The distributions (a) and (b) correspond to beam pulse patterns (a) and (b) in Fig. 2 and were measured with a Markus chamber. They were scaled in the figure such that their sum has a (c) constant dose plateau, as by a conventional dose delivery. The distributions (a) and (b) were computed with the LET correction based on the time-resolved data obtained in measuring (a) and (b). The depth-dose measured without splitting the field delivery is shown in the dotted line.
Figure 5
Figure 5
Average ratios measured by DVS dosimeters in comparison with the ratio functions computed from the data obtained in the preliminary measurement for determining the value of parameterλ. The thicker dark line is calculated directly from the IC-measured depth doses and the thinner dark line is computed from the model fit of the measured data. The gray lines are also computed from the model fit but with the MOSFET LET correction for a range of values ofλ.
Figure 6
Figure 6
The average deviation between actual positions of the DVS dosimeter and those derived from the LET-correction model as a function of the parameterλ.
Figure 7
Figure 7
Average ratios measured by DVS dosimeters (diamonds) and the Markus chamber (triangles) at discrete depths for type I field pair in comparison with the ratio functions calculated directly from the measured depth doses (upper) and with LET corrections (lower). The error bars show the standard deviations in DVS measured ratios.
Figure 8
Figure 8
Average ratios measured by DVS dosimeters (diamonds) and the Markus chamber (triangles) at discrete depths for type II field pair, in comparison with the ratio functions calculated directly from the measured depth doses (upper) and with LET corrections (lower). The error bars show the standard deviations in DVS measured ratios.
Figure 9
Figure 9
A test of the LET-correction model based on the data obtained in Ref. from measuring a Bragg peak distribution by an ion chamber (upper) and a MOSFET dosimeter (lower).

References

    1. Goitein M., “Magical protons?,” Int. J. Radiat. Oncol., Biol., Phys. IOBPD3 70, 654–656 (2008).10.1016/j.ijrobp.2007.10.057 - DOI - PubMed
    1. Schaffner B. and Pedroni E., “The precision of proton range calculations in proton radiotherapy treatment planning: Experimental verification of the relation between CT-HU and proton stopping power,” Phys. Med. Biol. PHMBA7 43, 1579–1592 (1998).10.1088/0031-9155/43/6/016 - DOI - PubMed
    1. Minohara S., Endo M., Kanai T., Kato H., and Tsujii H., “Estimating uncertainties of the geometrical range of particle radiotherapy during respiration,” Int. J. Radiat. Oncol., Biol., Phys. IOBPD3 56, 121–125 (2003).10.1016/S0360-3016(03)00092-0 - DOI - PubMed
    1. Engelsman M. and Kooy H., “Target volume dose considerations in proton beam treatment planning for lung tumors,” Med. Phys. MPHYA6 32, 3549–3557 (2005).10.1118/1.2126187 - DOI - PubMed
    1. Lu H., “A potential method for in vivo range verification in proton therapy treatment,” Phys. Med. Biol. PHMBA7 53, 1413–1424 (2008).10.1088/0031-9155/53/5/016 - DOI - PubMed