. 2010 Dec 15;24(24):2812-22.
doi: 10.1101/gad.608210.

Cohesin organizes chromatin loops at DNA replication factories

Affiliations

Cohesin organizes chromatin loops at DNA replication factories

Emmanuelle Guillou et al. Genes Dev. .

Abstract

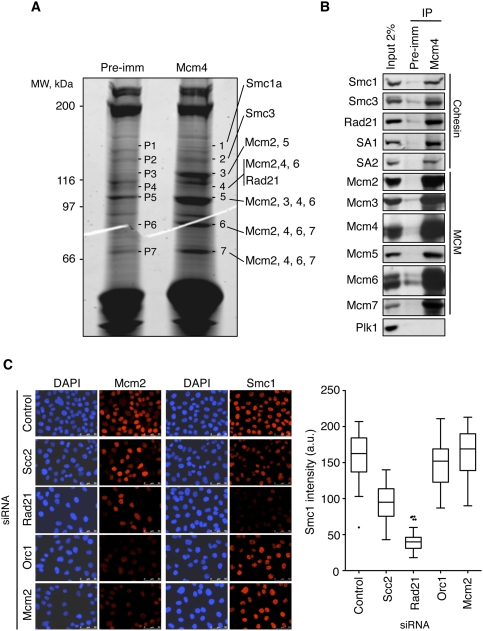
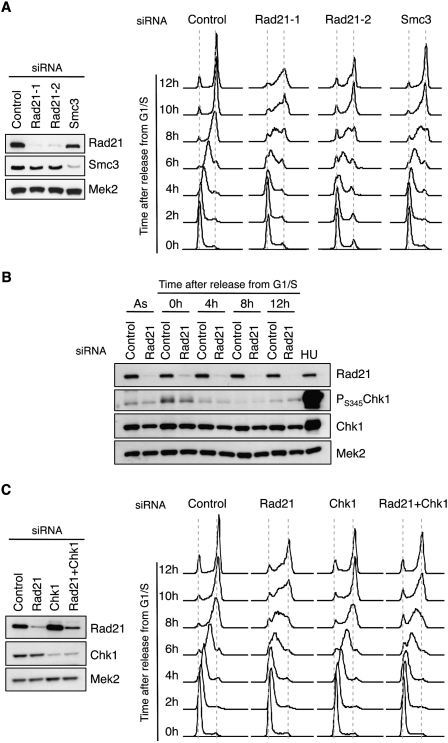
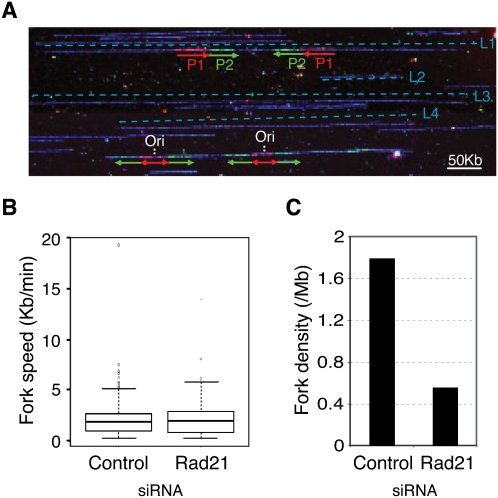
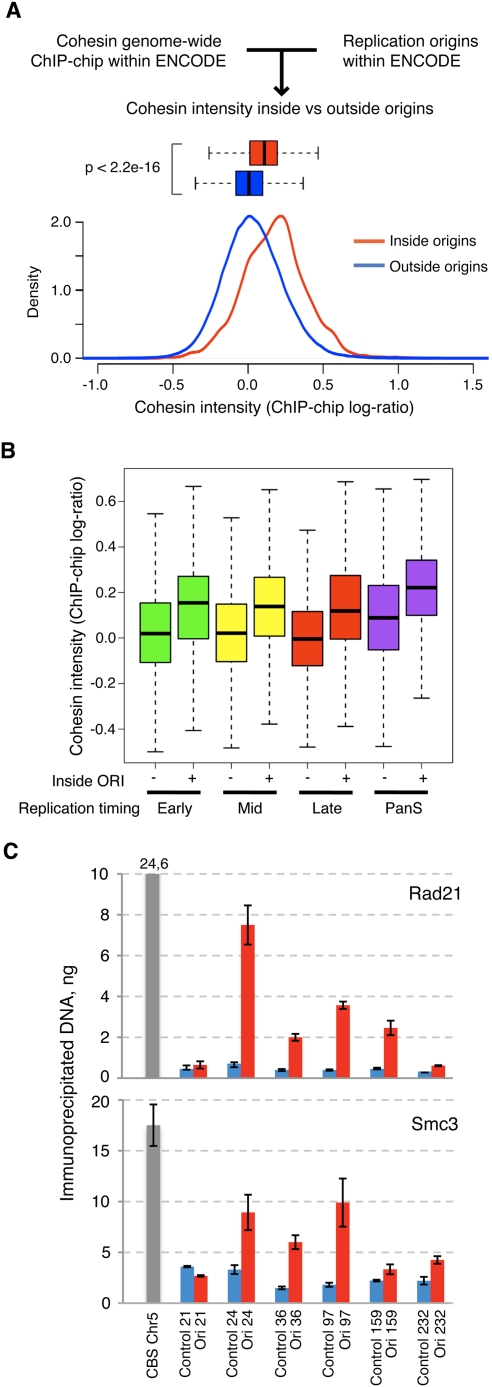
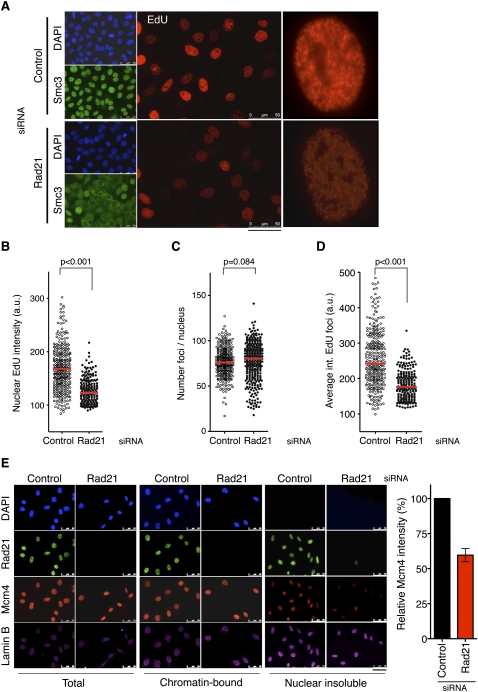
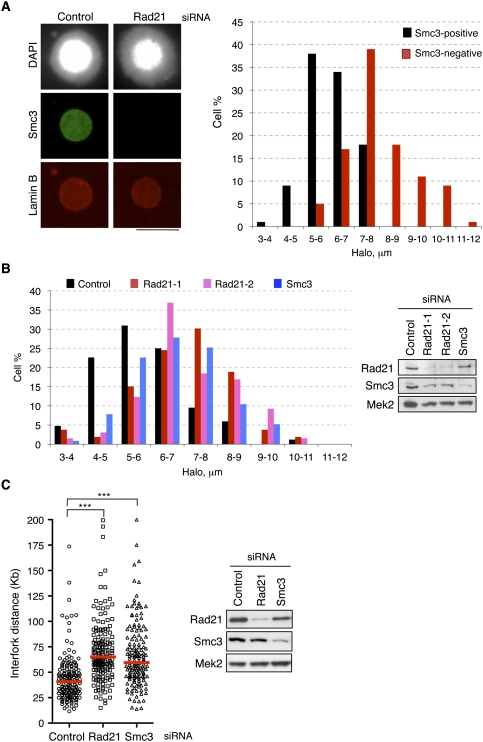
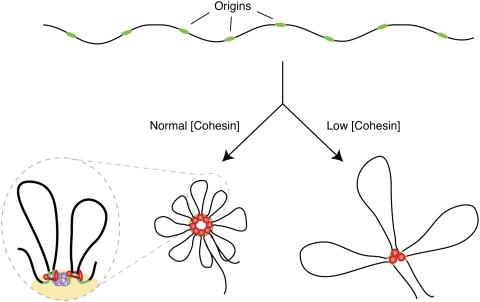
Genomic DNA is packed in chromatin fibers organized in higher-order structures within the interphase nucleus. One level of organization involves the formation of chromatin loops that may provide a favorable environment to processes such as DNA replication, transcription, and repair. However, little is known about the mechanistic basis of this structuration. Here we demonstrate that cohesin participates in the spatial organization of DNA replication factories in human cells. Cohesin is enriched at replication origins and interacts with prereplication complex proteins. Down-regulation of cohesin slows down S-phase progression by limiting the number of active origins and increasing the length of chromatin loops that correspond with replicon units. These results give a new dimension to the role of cohesin in the architectural organization of interphase chromatin, by showing its participation in DNA replication.


Figures

Figure 1.
Figure 1.
MCM complex interacts with cohesin. (A) Sypro-ruby staining of preimmune (pre-imm) and Mcm4 immunoprecipitates after SDS-PAGE fractionation. The indicated bands (1–7, and corresponding controls, P1–P7) were excised from the gel and analyzed by mass spectrometry. Mcm2–7 proteins and three components of the cohesin complex (Smc1a, Smc3, and Rad21) were identified (Supplemental Table S1). (B) Immunoprecipitations (IP) from HeLa nuclear extracts synchronized in S phase using Mcm4 or preimmune antibodies. Immunoprecipitates and input extract (2% of the amount used in the immunoprecipitation) were analyzed by Western blot with the indicated antibodies. Polo kinase 1 (Plk1) is shown as a negative control. (C) Immunostaining of chromatin-bound Mcm2, Smc1 proteins (red), and DNA (DAPI, blue) in control cells or after treatment with the indicated siRNAs. Bar, 50 μm. (Right panel) Box plot showing the quantification of Smc1 staining intensity in the different cell populations shown (n > 100 cells in each condition).
Figure 2.
Figure 2.
Cohesin down-regulation impairs S-phase progression. (A, left) Immunoblots showing Rad21 and Smc3 levels in control cells or cells treated with three different siRNA oligonucleotides targeting cohesin (Rad21-1, Rad21-2, and Smc3). Mek2 levels are shown as loading control. (Right) DNA content analysis of the indicated siRNA-treated populations at different times after release from a G1/S block. (B) Detection of Rad21, PS345-Chk1, and total Chk1 levels after Rad21 down-regulation in asynchronous cells (As) or at the indicated times after release from a G1/S block. (HU) Cells treated with 2 mM hydroxyurea for 2 h, a control for checkpoint activation. The levels of Mek2 are shown as loading control. (C) S-phase progression, as in A, of cell populations treated with control, Rad21, Chk1, or Rad21 + Chk1 siRNA. Immunoblots on the left show the remaining levels of Rad21, Chk1, and Mek2 (loading control).
Figure 3.
Figure 3.
Cohesin influences origin activity. (A) Representative image of combed DNA fibers after IdU + CldU double pulse-labeling. Immunodetection of IdU (red), CldU (green), or ssDNA (blue) are shown. Fork directionality and track length for the first (P1) and second (P2) pulses are shown by red and green arrows, respectively. The positions of two bicolor signals corresponding to moving forks and two “green–red–green” signals corresponding to replication origins (Ori) are indicated. Bar, 25 μm (50 kb). (B) Box plot showing fork progression rates in asynchronous populations of control or Rad21-depleted cells (control: n = 250 forks; Rad21: n = 175 forks). The horizontal line within the box represents the median. The box spans the interquartile range, and the vertical line spans the lower and upper quartiles. Outliers are shown as circles. (C) Global fork density in the same populations as in B, estimated by dividing the number of unambiguous forks by the total length of analyzed DNA and normalized to the number of cells in S phase (see the Materials and Methods; Supplemental Table S2).
Figure 4.
Figure 4.
Cohesin is enriched at origins of replication regardless of their timing of replication. (A) Signal distribution of cohesin abundance at genomic intervals located inside (red) and outside (blue) origins. Signal distributions are also represented in box plots (boxes contain the second and third data quartiles, and whiskers cover the two extreme quartiles). (B) Box plots showing the distribution of cohesin signal inside or outside origins in genomic regions that replicate in early-, mid-, or late-S phase or at any given time during S phase (panS). (C) ChIP analysis showing the relative abundance of Rad21 and Smc3 at six genomic regions containing replication origins (red bars), and six adjacent, control regions (blue bars) (Supplemental Table S4). The amount of immunoprecipitated DNA and standard error in a triplicate experiment are represented. A known CBS located at chromosome 5 was used as positive control (gray bar).
Figure 5.
Figure 5.
Cohesin down-regulation affects DNA replication foci and impairs MCM localization to the nucleoskeleton. (A) Visualization of replication foci by EdU incorporation (red) in control or Rad21 silenced cells. Smc3 staining (green) and DNA staining with DAPI (blue) are shown. Bar, 50 μm. A single nucleus from each population is shown at higher magnification. (B) Box plot showing the automatic, unbiased quantification of nuclear EdU intensity in control or Rad21-depleted cells (n > 200 in each condition). (C) Quantification, as in B, of the number of detected foci per nucleus. (D) Quantification, as in B, of the average intensity of individual foci per nucleus. (E) Control cells or cells treated with Rad21 siRNA were synchronized in G1/S and submitted to serial in situ extractions to access the chromatin-bound fraction and the insoluble fraction reflecting the nucleoskeleton. DNA was stained with DAPI (blue), and Rad21 (green), Mcm4 (red), and Lamin B (magenta) were detected by immunofluorescence. Bar, 50 μm. For image acquisition, the same exposure time was used for each fluorophore in samples subjected to the same treatment. The histogram shows the average intensity of Mcm4 staining in the nuclear insoluble fraction (n > 40 cells for each condition in each of three independent experiments).
Figure 6.
Figure 6.
Cohesin regulates the length of chromatin loops. (A) Nuclei from control and Rad21-depleted cells synchronized in G1/S were mixed, attached to the same coverslip, and subjected to the treatment to generate DNA halos. (Left) Immunofluorescence of these nuclei showing DNA (grayscale image), Smc3 (green), and Lamin B (red) stainings. Bar, 25 μm. Smc3-positive and Smc3-negative halo radii were measured (n = 100 for each condition). (Right) Histogram showing radii measurements grouped in nine intervals (a–b: value ≥a and <b). (B) Distribution of DNA halo size after the down-regulation of Rad21 or Smc3 proteins with the indicated siRNA oligonucleotides. Immunoblots show the efficiency of RNAi-mediated silencing. (C) Interfork distance determined by single-molecule analysis of replication forks after down-regulation of cohesin subunits Rad21 and Smc3 (n = 150 for each condition). Three asterisks indicate P-value < 0.001.
Figure 7.
Figure 7.
Architectural role of cohesin at replication foci: a model. Potential replication origins (green) within a DNA region (black) are grouped in rosette-like structures by the action of cohesin (red dots). Loss of cohesin may destabilize this structural arrangement resulting in fewer, longer loops. The magnified illustration shows cohesin stabilization of loops and its interaction with MCM at a replication factory (yellow). See the text for details.

Comment in

  • New temptations in SMC research.
    Sjögren C. Sjögren C. Nat Rev Mol Cell Biol. 2012 Apr 4;13(5):282. doi: 10.1038/nrm3331. Nat Rev Mol Cell Biol. 2012. PMID: 22473469 No abstract available.

References

    1. Berezney R, Dubey DD, Huberman JA 2000. Heterogeneity of eukaryotic replicons, replicon clusters, and replication foci. Chromosoma 108: 471–484 - PubMed
    1. Borlado LR, Mendez J 2008. CDC6: From DNA replication to cell cycle checkpoints and oncogenesis. Carcinogenesis 29: 237–243 - PubMed
    1. Buongiorno-Nardelli M, Micheli G, Carri MT, Marilley M 1982. A relationship between replicon size and supercoiled loop domains in the eukaryotic genome. Nature 298: 100–102 - PubMed
    1. Cadoret JC, Meisch F, Hassan-Zadeh V, Luyten I, Guillet C, Duret L, Quesneville H, Prioleau MN 2008. Genome-wide studies highlight indirect links between human replication origins and gene regulation. Proc Natl Acad Sci 105: 15837–15842 - PMC - PubMed
    1. Casado-Vela J, Martinez-Torrecuadrada JL, Casal JI 2009. Differential phosphorylation patterns between the Cyclin-A2/CDK2 complex and their monomers. Protein Expr Purif 66: 15–21 - PubMed

Publication types