. 2011 Mar;85(5):2254-65.
doi: 10.1128/JVI.00006-10. Epub 2010 Dec 15.

Inhibition of early stages of HIV-1 assembly by INI1/hSNF5 transdominant negative mutant S6

Affiliations

Inhibition of early stages of HIV-1 assembly by INI1/hSNF5 transdominant negative mutant S6

Jennifer Cano et al. J Virol. 2011 Mar.

Abstract

INI1/hSNF5 is an HIV-1 integrase (IN) binding protein specifically incorporated into virions. A truncated mutant of INI1 (S6, amino acids 183 to 294) harboring the minimal IN binding Rpt1 domain potently inhibits HIV-1 particle production in a transdominant manner. The inhibition requires interaction of S6 with IN within Gag-Pol. While INI1 is a nuclear protein and harbors a masked nuclear export signal (NES), the transdominant negative mutant S6 is cytoplasmic, due to the unmasking of NES. Here, we examined the effects of subcellular localization of S6 on HIV-1 inhibition and further investigated the stages of assembly that are affected. We found that targeting a nuclear localization signal-containing S6 variant [NLS-S6(Rpt1)] to the nucleoplasm (but not to the nucleolus) resulted in complete reversal of inhibition of particle production. Electron microscopy indicated that although no electron-dense particles at any stage of assembly were seen in cells expressing S6, virions were produced in cells expressing the rescue mutant NLS-S6(Rpt1) to wild-type levels. Immunofluorescence analysis revealed that p24 exhibited a diffuse pattern of localization within the cytoplasm in cells expressing S6 in contrast to accumulation along the membrane in controls. Pulse-chase analysis indicated that in S6-expressing cells, although Gag(Pr55(gag)) protein translation was unaffected, processing and release of p24 were defective. Together, these results indicate that expression of S6 in the cytoplasm interferes with trafficking of Gag-Pol/Gag to the membrane and causes a defective processing leading to inhibition of assembly at an early stage prior to particle formation and budding.


Figures

FIG. 1.
FIG. 1.
Subcellular localization of INI1 mutants. (A) Diagram illustrating CFP fusions of INI1 and truncation mutants S6 and S6(Rpt1), with or without SV40 NLS sequences. Horizontal lines in the diagram illustrate the deleted region. Rpt, repeat; NES, nuclear export signal; HR3, homology region 3. (B) Immunoblot analysis of total proteins from cells expressing CFP fusions of INI1 and truncations in the presence or absence of HIV-1. The blots were probed with α-GFP antibodies to detect CFP fusions. Tubulin was detected as a loading control. Asterisks above the bands indicate a protein of the appropriate size. (C and D) Subcellular localization of CFP-INI1 and truncation mutants in the presence or absence of NLS. Panels C and D show confocal images of cells transfected with the indicated CFP fusion constructs (C [without NLS] and D [with NLS]). The panels show GFP fluorescence (left columns), propidium iodide (PI) fluorescence (middle columns), and overlays of the two (right columns).
FIG. 2.
FIG. 2.
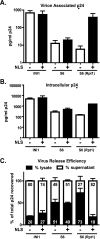
Effect of subcellular localization of S6 mutants on HIV-1 viral protein synthesis and particle production. (A) Levels of virion associated p24 in culture supernatants of cells transfected with variants of S6. (B) Levels of intracellular p24 in the producer cells transfected with variants of S6. (C) Graphic representation of p24 release efficiency, as determined by the fraction of virion- and cell- associated p24 compared to that of the total p24 based on values in panels A and B. The values are expressed as percentages of the total.
FIG. 3.
FIG. 3.
Subcellular localization of C-terminal truncation mutants of INI1. (A) Diagram illustrating position of NES in INI1, alanine, and/or proline substitution of hydrophobic residues within NES. (B) Schematic diagram of GFP fusions of C19 and C19 mutants with substitutions at NES. (C) Immunoblot analysis of total proteins from cells expressing GFP fusions of C19 and C19 mutants using α-GFP antibody. α-GAPDH was used as a loading control. (D) Subcellular localization of GFP-INI1/C19 and mutants with substitutions at the NES. Cells transfected with the indicated GFP fusion constructs were imaged by confocal microscopy. The panels show the GFP fluorescence (left column), propidium iodide (PI) fluorescence (middle column), and overlays of the two (right column).
FIG. 4.
FIG. 4.
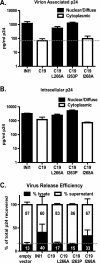
Effect of subcellular localization of C19 mutant on HIV-1 viral protein synthesis and particle production. (A) Virion-associated p24 in culture supernatants of cells transfected with GFP-C19 and mutants. (B) Levels of intracellular p24 in the producer cells transfected with GFP-C19 and mutants. (C) Graphic representation of p24 release efficiency, as determined by the fraction of virion- and cell-associated p24 compared to that of the total p24 based on values in panels A and B. The values are expressed as percentages of the total.
FIG. 5.
FIG. 5.
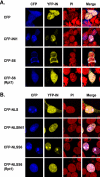
Colocalization of INI1 and S6 mutants with HIV-1 IN. Confocal microscopic analysis of 293T cells transfected with equal amounts of YFP-IN and various CFP-fusions of INI1 or S6 mutants without (A) or with (B) NLS as indicated on the left of the panels. The panels show the CFP fluorescence (first column), YFP fluorescence (second column), propidium iodide (PI) fluorescence (third column), and an overlay of the three (last column).
FIG. 6.
FIG. 6.
Ultrastructural studies to determine the effect of S6 and NLSS6(Rpt1) on HIV-1 particle production. Transmission electron micrographs of cells transfected with HIV-1R3B (A), CFP-INI1 plus HIV-1R3B (B), CFP-NLSS6(Rpt1) plus HIV-1R3B (C), and CFP-S6 plus HIV-1R3B (D) are shown. All images are at ×14,000 magnification.
FIG. 7.
FIG. 7.
Immunofluorescence analysis to determine the effects of S6 and NLSS6(Rpt1) on Gag expression and localization. (A) Specificity of immunostaining by α-p24 antibodies. Confocal images of cells not transfected (top row) or transfected (bottom row) with HIV-1R3B and immunostained using α-p24 antibodies and PE-conjugated secondary antibodies are shown. Leftmost column, DAPI fluorescence to stain the nuclei; middle column, PE fluorescence indicating p24 staining; right column, merge of the two. (B and C) Differential subcytoplasmic localization of p24 in cells expressing S6 and other mutants. Panel B shows merged confocal images (without zoom, ×63) of cells transfected with either HIV-1R3B alone or HIV-1R3B along with CFP-INI1, CFP-S6, or CFP-NLSS6(Rpt1). CFP and PE fluorescence images indicate the expression of CFP fusion proteins and p24, respectively. Panel C shows confocal images (with ×4 zoom) of cells transfected with HIV-1R3B along with CFP-INI1, CFP-S6, CFPNLSS6(Rpt1), or CFP-NLSS6, respectively, and immunostained with α-p24 antibodies. Left most column, CFP fluorescence indicating the expression of CFP fusion proteins; middle column, PE fluorescence indicating the expression of p24; right column, the merge of the two. (D) Graphic representation of fold changes in mean p24 intensity (± the standard error of the mean [SEM]) from the nuclear membrane to the plasma membrane, with the distance across the cytoplasm represented in pixels. Panels A and C show images at ×63 magnification with a ×4 zoom. Panel B shows images at ×63 magnification without zoom.
FIG. 8.
FIG. 8.
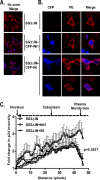
Immunofluorescence analysis to determine the effect of S6 on Gag localization in HIV-1 lacking IN. (A and B) Confocal images of cells, transfected with SG3ΔIN, SG3ΔIN+CFP-INI1, or SG3ΔIN+CFPS6, and immunostained using α-p24 antibodies and PE-conjugated secondary antibodies. Panel A shows merged confocal images of cells (magnification, ×63). Panel B shows confocal images (magnification, ×63, with a ×4 zoom) of cells. Left column, CFP fluorescence indicating expression of CFP fusion proteins; middle column, PE fluorescence indicating expression of p24; right column, the merge of the two. (C) Graphic representation of fold changes in mean p24 intensity (± the SEM) from the nuclear membrane to the plasma membrane, with the distance across the cytoplasm represented in pixels.
FIG. 9.
FIG. 9.
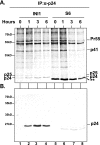
Pulse-chase analysis to determine the effect of S6 on Gag translation, stability, and processing. (A and B) SDS-PAGE analysis of the α-p24 antibody-mediated immunoprecipitations (IP) of the transfected cell lysate (A) or of the virus containing culture supernatants (B). Producer cells expressing either INI1 or S6 were metabolically labeled with 35S, and cell- and virus-associated p24 were immunoprecipitated using α-p24 antibodies at 0, 1, 3, and 6 h postchase. Pr55 (Gag), p41 (CA-MA), p25 (CA-p2), and p24 (CA) are indicated. Asterisks mark a species smaller than p24 that was evident in S6-transfected cells.

References

    1. Asp, P., M. Wihlborg, M. Karlen, and A. K. Farrants. 2002. Expression of BRG1, a human SWI/SNF component, affects the organisation of actin filaments through the RhoA signaling pathway. J. Cell Sci. 115:2735-2746. - PubMed
    1. Batonick, M., et al. 2005. Interaction of HIV-1 Gag with the clathrin-associated adaptor AP-2. Virology 342:190-200. - PubMed
    1. Briones, M. S., C. W. Dobard, and S. A. Chow. Role of human immunodeficiency virus type 1 integrase in uncoating of the viral core. J. Virol. 84:5181-5190. - PMC - PubMed
    1. Brown, P. 1997. Integration, p. 161-203. In J. M. Coffin, S. H. Hughes, and H. E. Varmus (ed.), Retroviruses. Cold Spring Harbor Laboratory Press, Cold Spring Harbor, NY.
    1. Camus, G., et al. 2007. The clathrin adaptor complex AP-1 binds HIV-1 and MLV Gag and facilitates their budding. Mol. Biol. Cell 18:3193-3203. - PMC - PubMed

Publication types

MeSH terms