

A decrementing form of plasticity apparent in cerebellar learning
- PMID: 21159969
- PMCID: PMC3014316
- DOI: 10.1523/JNEUROSCI.2455-10.2010
A decrementing form of plasticity apparent in cerebellar learning
Abstract
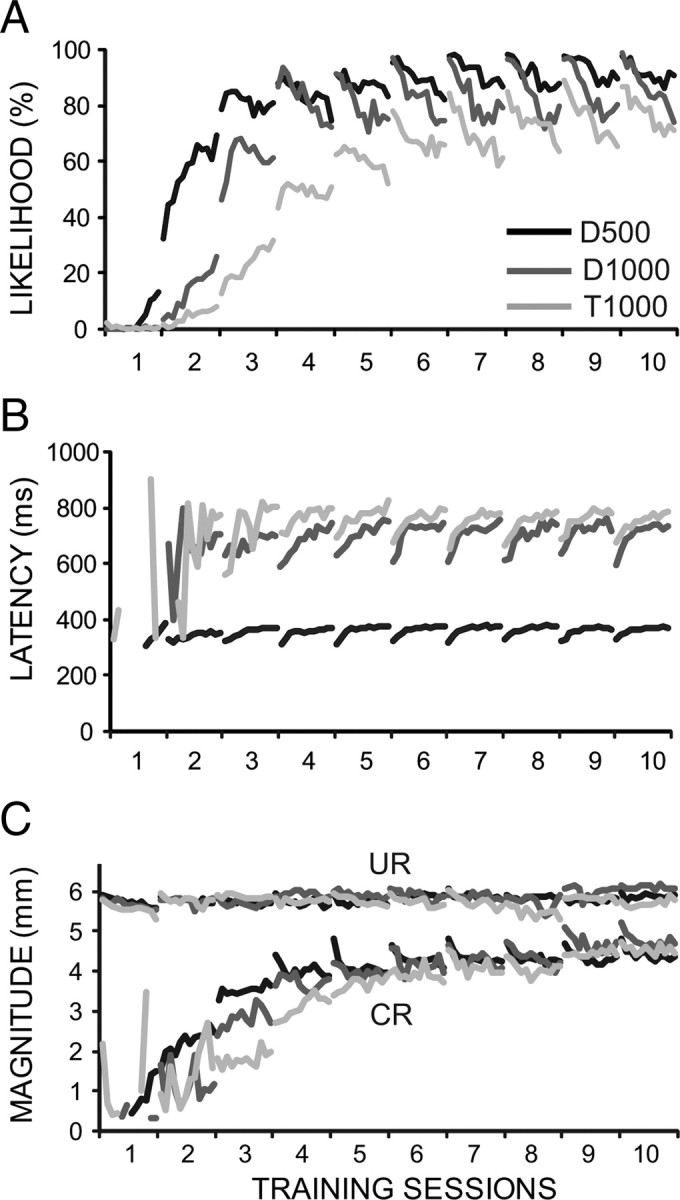
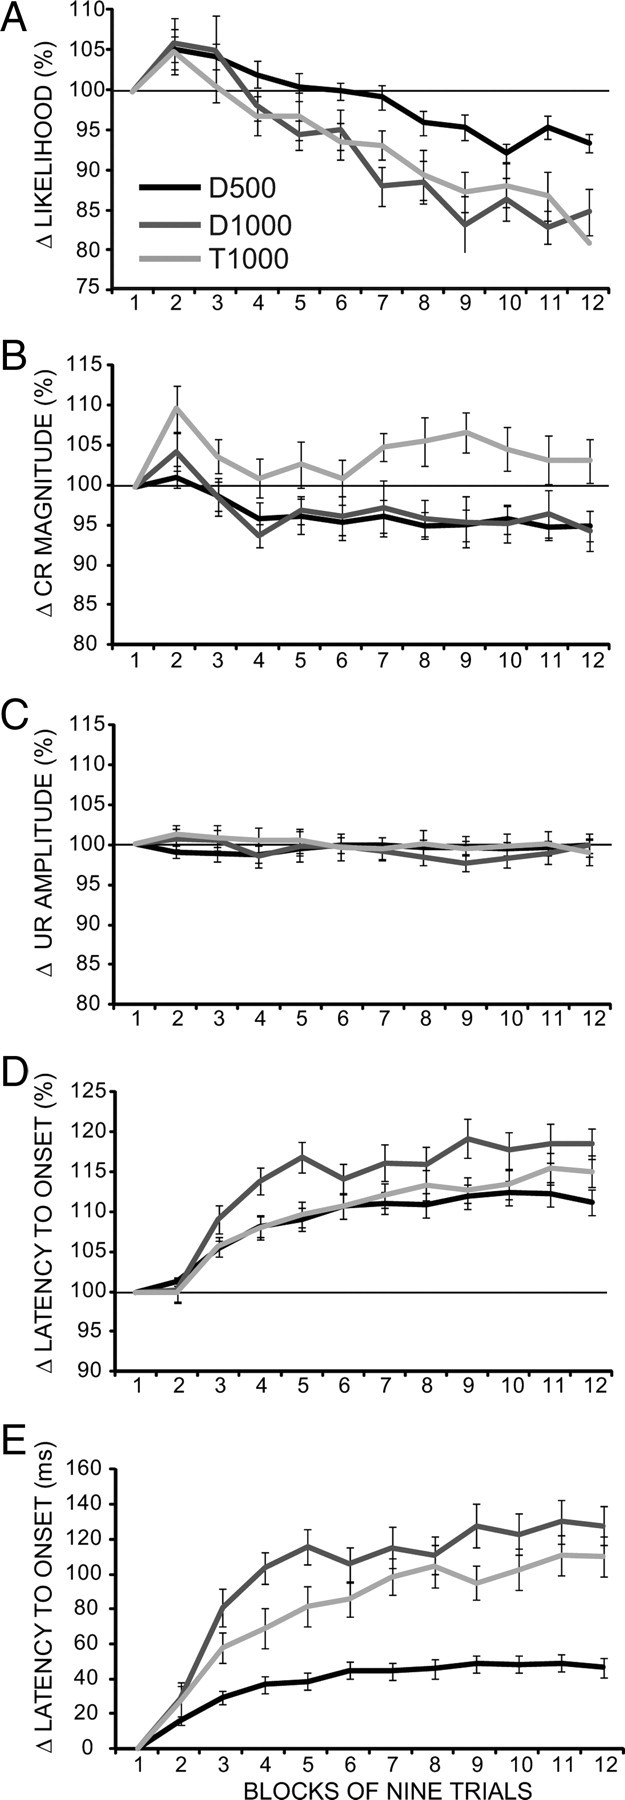
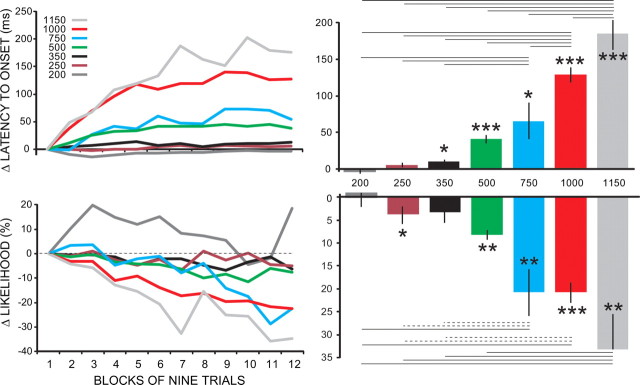
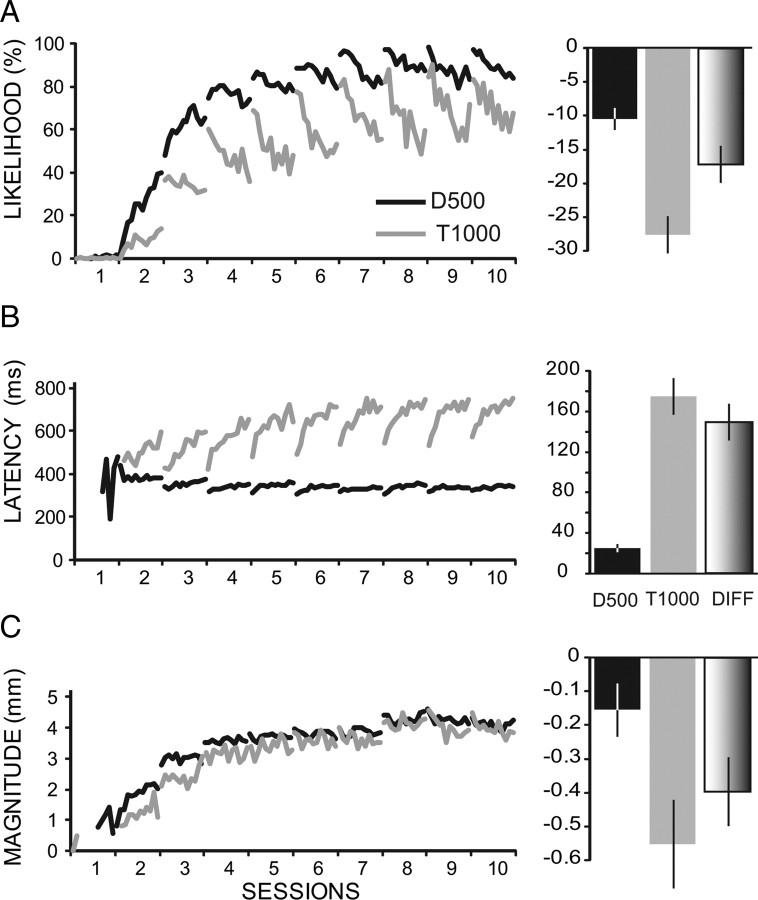
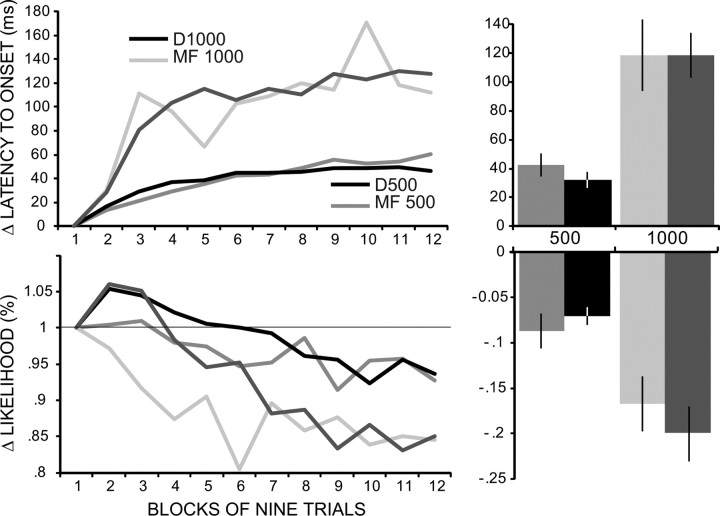
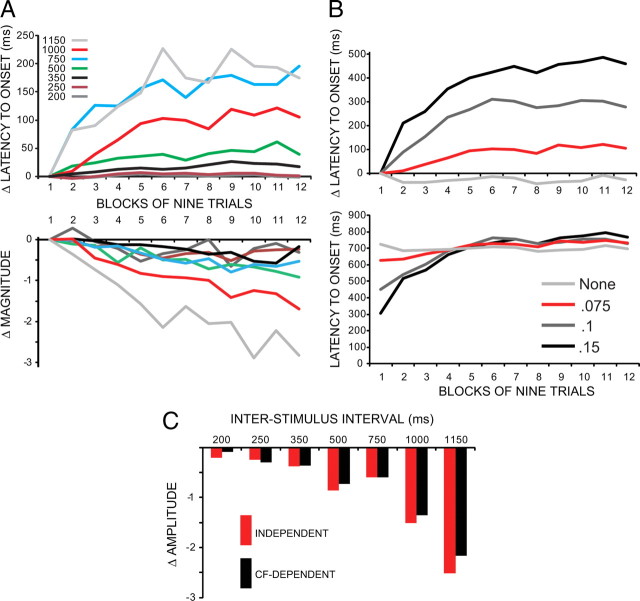
Long-term synaptic plasticity is believed to underlie the capacity for learning and memory. In the cerebellum, for example, long-term plasticity contributes to eyelid conditioning and to learning in eye movement systems. We report evidence for a decrementing form of cerebellar plasticity as revealed by the behavioral properties of eyelid conditioning in the rabbit. We find that conditioned eyelid responses exhibit within-session changes that recover by the next day. These changes, which increase with the interstimulus interval, involve decreases in conditioned response magnitude and likelihood as well as increases in latency to onset. Within-subject comparisons show that these changes differ in magnitude depending on the type of training, arguing against motor fatigue or changes in motor pathways downstream of the cerebellum. These phenomena are also observed when stimulation of mossy fibers substitutes for the conditioned stimulus, suggesting that changes take place within the cerebellum or in downstream efferent pathways. Together, these observations suggest a plasticity mechanism in the cerebellum that is induced during training sessions and fades within 23 h. To formalize this hypothesis more specifically, we show that incorporating a short-lasting potentiation at the granule cell to Purkinje cell synapses in a computer simulation of the cerebellum reproduces these behavioral effects. We propose the working hypothesis that the presynaptic form of long-term potentiation observed at these synapses is reversed by time rather than by a corresponding long-term depression. These results demonstrate the utility of eyelid conditioning as a means to identify and characterize the rules that govern input to output transformations in the cerebellum.
Figures
Similar articles
-
Temporal patterns of inputs to cerebellum necessary and sufficient for trace eyelid conditioning.J Neurophysiol. 2010 Aug;104(2):627-40. doi: 10.1152/jn.00169.2010. Epub 2010 May 19. J Neurophysiol. 2010. PMID: 20484534 Free PMC article.
-
Changes in cerebellar intrinsic neuronal excitability and synaptic plasticity result from eyeblink conditioning.Neurobiol Learn Mem. 2019 Dec;166:107094. doi: 10.1016/j.nlm.2019.107094. Epub 2019 Sep 19. Neurobiol Learn Mem. 2019. PMID: 31542329 Free PMC article. Review.
-
Simulations of cerebellar motor learning: computational analysis of plasticity at the mossy fiber to deep nucleus synapse.J Neurosci. 1999 Aug 15;19(16):7140-51. doi: 10.1523/JNEUROSCI.19-16-07140.1999. J Neurosci. 1999. PMID: 10436067 Free PMC article.
-
Evidence of plasticity in the pontocerebellar conditioned stimulus pathway during classical conditioning of the eyeblink response in the rabbit.Behav Neurosci. 1998 Apr;112(2):267-85. doi: 10.1037//0735-7044.112.2.267. Behav Neurosci. 1998. PMID: 9588477
-
Cerebellar mechanisms of learning and plasticity revealed by delay eyelid conditioning.Int Rev Neurobiol. 2014;117:21-37. doi: 10.1016/B978-0-12-420247-4.00002-6. Int Rev Neurobiol. 2014. PMID: 25172627 Review.
Cited by
-
Asymmetries in Cerebellar Plasticity and Motor Learning.Cerebellum. 2016 Apr;15(2):87-92. doi: 10.1007/s12311-014-0635-7. Cerebellum. 2016. PMID: 25578035 Free PMC article. Review.
-
Feedback inhibition underlies new computational functions of cerebellar interneurons.Elife. 2022 Dec 8;11:e77603. doi: 10.7554/eLife.77603. Elife. 2022. PMID: 36480240 Free PMC article.
-
Links Between Single-Trial Changes and Learning Rate in Eyelid Conditioning.Cerebellum. 2016 Apr;15(2):112-21. doi: 10.1007/s12311-015-0690-8. Cerebellum. 2016. PMID: 26112423
-
Time course of the rabbit's conditioned nictitating membrane movements during acquisition, extinction, and reacquisition.Learn Mem. 2014 Oct 15;21(11):585-90. doi: 10.1101/lm.034504.114. Print 2014 Nov. Learn Mem. 2014. PMID: 25320350 Free PMC article.
-
The 40-year history of modeling active dendrites in cerebellar Purkinje cells: emergence of the first single cell "community model".Front Comput Neurosci. 2015 Oct 20;9:129. doi: 10.3389/fncom.2015.00129. eCollection 2015. Front Comput Neurosci. 2015. PMID: 26539104 Free PMC article. Review.
References
-
- Abbott LF, Nelson SB. Synaptic plasticity: taming the beast. Nat Neurosci. 2000;(3 Suppl):1178–1183. - PubMed
-
- Aitkin LM, Boyd J. Acoustic input to the lateral pontine nuclei. Hear Res. 1978;1:67–77. - PubMed
-
- Barbour B. Synaptic currents evoked in Purkinje cells by stimulating individual granule cells. Neuron. 1993;11:759–769. - PubMed
Publication types
MeSH terms
Grants and funding
LinkOut - more resources
Full Text Sources