. 2010 Dec 15;30(50):17023-34.
doi: 10.1523/JNEUROSCI.4543-10.2010.

How, when, and where new inhibitory neurons release neurotransmitters in the adult olfactory bulb

Affiliations

How, when, and where new inhibitory neurons release neurotransmitters in the adult olfactory bulb

Cedric Bardy et al. J Neurosci. .

Abstract

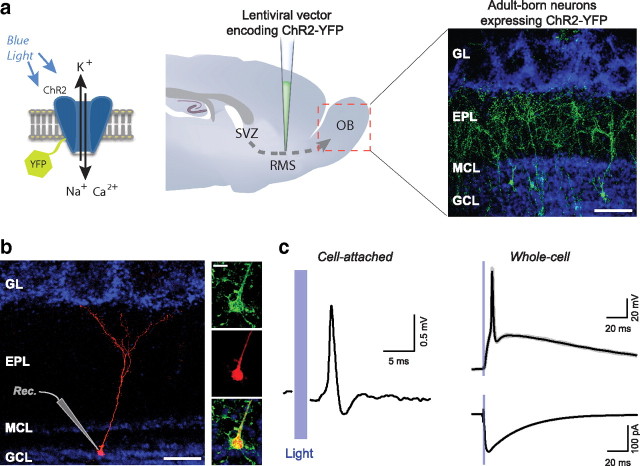
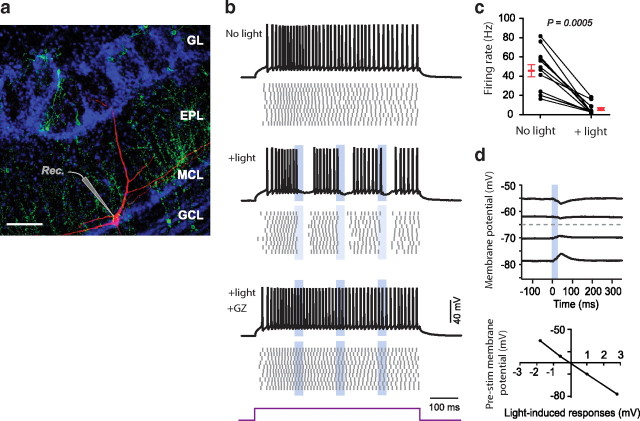
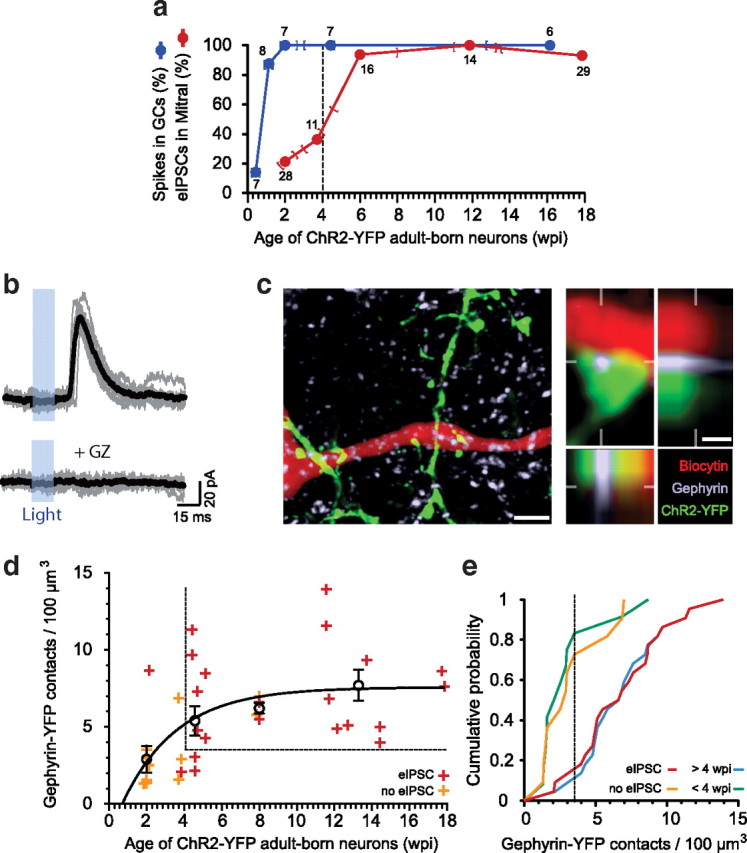
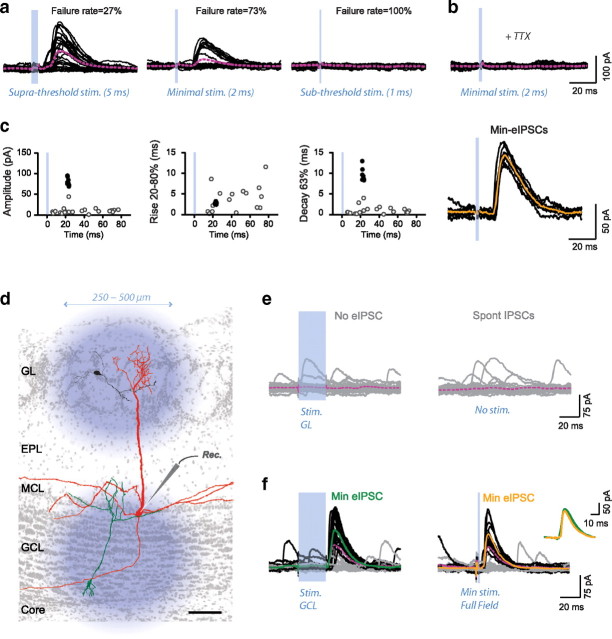
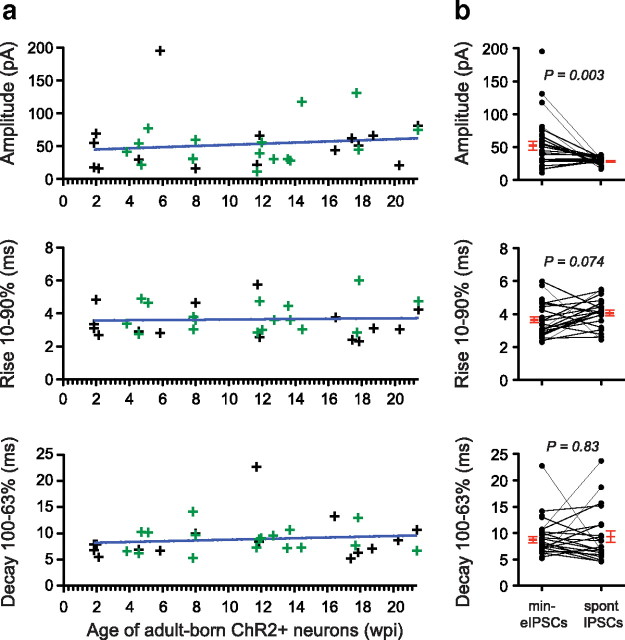
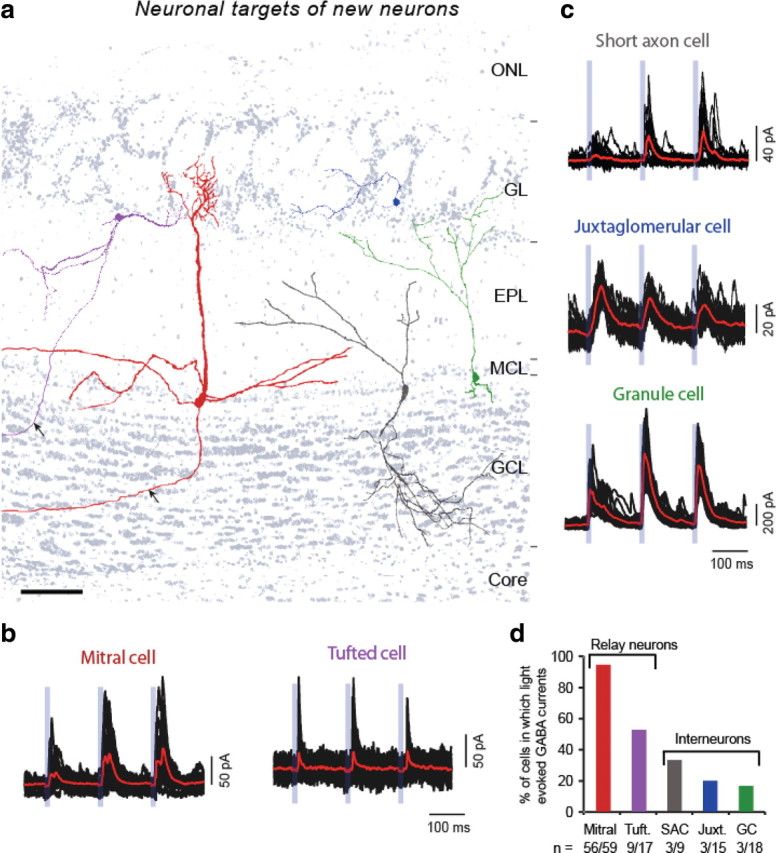
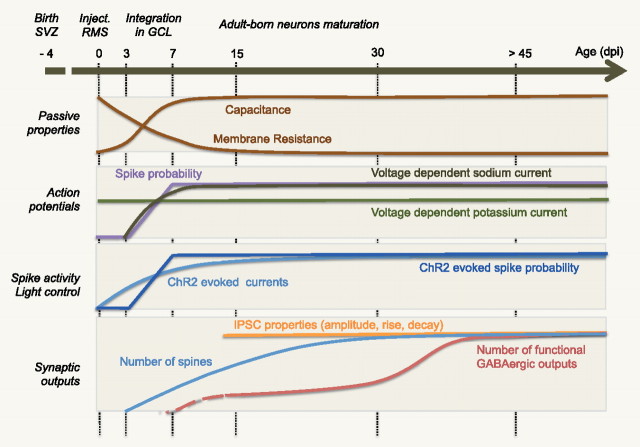
Adult-born neurons continuously incorporate into the olfactory bulb where they rapidly establish contacts with a variety of synaptic inputs. Little is known, however, about the functional properties of their output. Characterization of synaptic outputs from new neurons is essential to assess the functional impact of adult neurogenesis on mature circuits. Here, we used optogenetics to control neurotransmitter release from new neurons. We found that light-induced synaptic GABA release from adult-born neurons leads to profound modifications of postsynaptic target firing patterns. We revealed that functional output synapses form just after new cells acquire the faculty to spike, but most synapses were made a month later. Despite discrepancies in the timing of new synapse recruitment, the properties of postsynaptic signals remain constant. Remarkably, we found that all major cell types of the olfactory bulb circuit, including output neurons and several distinct subtypes of local interneurons, were contacted by adult-born neurons. Thus, this study provides new insights into how new neurons integrate into the adult neural network and may influence the sense of smell.


Figures

Figure 1.
Figure 1.
Remote control of adult-born neurons activity by light. a, Left, The ionotropic ChR2 is transiently activated by flashes of blue light (∼470 nm). Middle, To specifically express ChR2-YFP onto adult-born neurons, we performed stereotaxic injections of lentiviral vectors into the RMS. Right, Confocal image of an OB slice fixed after electrophysiological recordings. This photo shows the immunoreactivity of ChR2-YFP in adult-born neurons (green) and DAPI staining in all cell nuclei (blue). Scale bar, 100 μm. b, Confocal images showing a patch-clamped adult-born GC filled with biocytin (red) and producing ChR2-YFP (green). The green channel was intentionally removed in the image on the left for clarity. The different OB layers are visible with DAPI staining (blue) (GL, glomerular layer; EPL, external plexiform layer; MCL, mitral cell layer; GCL, granule cell layer). Insets show the soma of a patch-clamp-recorded cell at higher magnification. Scale bars, 100 μm (left) and 10 μm (right). c, Effects of brief exposure to light in an adult-born GC transduced with ChR2-YFP. Light-evoked action potentials in cell-attached (left; mean trace of 10 trials) or in whole-cell recordings (top-right, current-clamp −13 pA, Vm ≈ −70 mV; black trace, mean; gray traces, 10 trials). Light-induced inward currents through ChR2 (right-bottom, voltage-clamp −70 mV; black trace, mean; gray traces, 10 trials).
Figure 2.
Figure 2.
GABA released from adult-born neurons inhibits mitral cells. a, Confocal image showing a patch-clamped mitral cell filled with biocytin (red) and adult-born neurons expressing ChR2-YFP (green). Scale bar, 100 μm. b, Traces and raster plots (10 repeats) of current-clamp recordings showing the firing activity of a mitral cell, which was depolarized above spike threshold by injecting a steady current step (+100 pA). Mitral cell firing was repeatedly inhibited by blue light activation of adult-born neurons. The Gabazine (GZ) blocked the light-evoked inhibition. c, The firing rate was measured in a time window (50 ms) starting 10 ms after the onset of the first light stimulation and compared with the firing rate within the equivalent window in standard condition with no light stimuli (n = 12 mitral cells recorded at 17–21 wpi). p value (Wilcoxon test) is shown in italics. d, Current-clamp recordings of light-evoked postsynaptic potentials, either depolarizing or hyperpolarizing depending on the imposed membrane potential. The reversal potential of Cl was ∼−65 mV, corresponding to the reported resting membrane potential of mitral cells.
Figure 3.
Figure 3.
Time course of the formation of new functional synaptic outputs. a, The blue points represent the proportion of GCs for a given time postinjection in which at least one of three consecutive full-field flashes (7.5 Hz) of blue light-evoked action potentials with >0.8 success rate. The red points represent the proportion of mitral cells for a given time postinjection in which eIPSCs were clearly distinguishable from the spontaneous synaptic activity. The corresponding number of cells pooled together is shown next to each time point. The x-axis positions of each point represent the median of the time postinjection and the range is represented with the brackets on the connecting lines. The recorded mitral cells (n = 98) in the present sample had detectable lateral dendrites (>100 μm) and homogenous sIPSCs frequencies and amplitudes (see supplemental Fig. 4, available at www.jneurosci.org as supplemental material). b, Voltage-clamp recordings of a mitral cell (14 dpi) at 0 mV illustrating light-induced postsynaptic inhibitory currents (eIPSCs; black traces, mean; gray traces, single sweeps). The responses disappeared in the presence of GABAA receptor antagonist (10 μm GZ). c–e, To assess the proportion of adult-born GABAergic synaptic contacts impinging onto mitral cells, we quantified the number of colocalized YFP and gephyrin puncta onto lateral dendrites of mitral cells (n = 34/98 cells). Biocytin included in the patch-clamp pipette revealed recorded mitral cells. c, Example of a gepherin puncta colocalized with biocytin and YFP. Scale bar, 3 μm (left) and 0.5 μm (right). d, The crosses represent the mitral cells in which light triggers IPSCs (red) or not (yellow). The circles represent the mean ± SEM of groups pooled according to time postinjection. The data were fitted with a nonlinear one-phase association (R2 = 0.31). The vertical dashed line was drawn at 4 wpi. Beyond this time point, 90% of mitral cells received light-evoked IPSCs. The horizontal dashed line was drawn at 3.5 puncta/100 μm3. Beyond this value, ∼90% of mitral cells received light-evoked IPSCs. e, Cumulative probability of the mitral cells (n = 34) distinguished on the presence (n = 22; red) or absence (n = 12; yellow) of eIPSCs, and recorded at a time postinjection >4 wpi (n = 22; blue) or <4 wpi (n = 12; green).
Figure 4.
Figure 4.
Restricted photostimulations of adult-born neurons in the OB. a, Example of mitral cell IPSCs evoked by flashes of different duration. Black traces represent the individual trials (n = 30) while purple traces represent the average synaptic current including failures. The light duration was decreased progressively until eIPSCs disappeared. The duration just above this threshold was chosen for the minimal stimulation. b, IPSCs evoked by minimal stimulation (min-eIPSCs) were blocked in presence of TTX (1 μm). c, In standard condition (ACSF + kynurenate), clear quantal min-eIPSC were selected and isolated from failure or eventual spontaneous events. The graphs represent the analysis of the peak currents in 30 trials, black circles for the selected trials and gray circles for the failures. The traces represent the trials in which a min-eIPSC was identified with the assistance of customized Matlab programs measuring the properties of the peak within a time window following the onset of the stimulation (black; n = 7) and the average (yellow). d, Full-field illuminations were used to optimize the probability of finding presynaptic and postsynaptic pairs. To identify which class of adult-born neuron was stimulated (GC in green; PGC in black), light flashes were consecutively focused in the GCL and in the GL while recording the mitral cells (red). The diameter of the light spot varied between 250 and 500 μm (see supplemental Fig. 9a, available at www.jneurosci.org as supplemental material). Scale bar, 100 μm. e, Light restricted to the GL did not evoke IPSCs distinguishable from spontaneous IPSCs. f, In sharp contrast, the same stimulation focused in the GCL clearly evoked IPSCs similar to min-eIPSCs obtained with minimal full-field stimulation. Identical results were obtained in all mitral cells tested similarly (n = 14). After recordings, all mitral cells were controlled to have intact apical dendrite reaching the GL.
Figure 5.
Figure 5.
Properties of the postsynaptic GABAergic currents from adult-born granule cells. a, We observed functional output signals (min-eIPSCs) from adult-born neurons as early as 13 d postinjection. To test their properties, we analyzed min-eIPSCs in mitral cells (n = 32) when stimulating ChR2-expressing new neurons at different age (weeks postinjection). Most of the min-eIPSCs (n = 17/32; green crosses) were evoked by stimulation of GCs, either by focusing the light in the GCL (n = 14/17), or by analyzing the min-eIPSCs received by mitral cells having a truncated apical dendrite (n = 3/17). The remaining responses (n = 15/32; black crosses) were obtained by minimum full-field stimulation without further investigation on the origin of the presynaptic neurons, but were not significantly different from the first group. The linear fits were performed on the pulled dataset and did not significantly deviate from zero (p > 0.45; R2 < 0.02). b, The properties of the min-eIPSCs (mean) and sIPSCs (median) were obtained in presence of kynurenate. Wilcoxon test p values are shown in italics. The averages ± SEM of the datasets are shown in red.
Figure 6.
Figure 6.
Postsynaptic targets of adult-born neurons are diverse. a, Reconstitution of mitral (red), tufted (purple), juxtaglomerular (blue), granule (green), and short axon (dark gray) cells after patch-clamp recordings. These cell types all received inhibitory synaptic contacts from adult-born neurons. Images were obtained from confocal pictures of recorded cells filled with biocytin and immunolabeled with streptavidine-Alexa 568. The photos of each type of cell were superimposed on a DAPI-stained section (light gray background). The morphology and the positions of the cells were not modified (see supplemental Fig. 11, available at www.jneurosci.org as supplemental material). Scale bar, 100 μm. b, c, Adult-born neurons were stimulated with three consecutive blue light pulses (15 ms). The traces show voltage-clamp (0 mV) recordings of the postsynaptic targets. Each sweep (n = 30) is shown in black and mean evoked currents in red. d, Although functional contacts were recorded in all subtypes, the proportions of responsive cells were much higher in relay neurons (65/76) than in interneurons (n = 9/42). All of the eIPSCs were obtained after 4 wpi.
Figure 7.
Figure 7.
Maturation of adult-born neurons and their synaptic outputs. The neuroblasts born in the SVZ migrate within ∼3 d to the injection site chosen in the present study. Three days after the injection, the first new GCs reach the GCL. Then, their dendrites reached the external plexiform layer (EPL) between 5 and 7 dpi (Panzanelli et al., 2009). The passive properties and the machinery to generate action potentials reached a mature state within <2 wpi (see supplemental Fig. 12, available at www.jneurosci.org as supplemental material and 13). The density of spines increased for slightly longer to reach a maximum ∼4 wpi (see supplemental Fig. 14, available at www.jneurosci.org as supplemental material) (Whitman and Greer, 2007). The formation of functional synaptic inhibitory outputs occurred at least in small proportions as early as 13 dpi. However, a large number of functional synaptic outputs were made between 4 and 6 wpi. Regardless, the properties of min-eIPSCs on mitral cells did not change over time. The sequential maturation of the properties illustrated here is based on original data reported either in the present paper or in supplemental material. Between 0 and 3 dpi the properties were extrapolated. Note also that the number of functional outputs between 0 and 12 dpi was extrapolated.

Similar articles

Cited by

References

    1. Altman J, Das GD. Post-natal origin of microneurones in the rat brain. Nature. 1965;207:953–956. - PubMed
    1. Alvarez-Buylla A, Lim DA. For the long run: maintaining germinal niches in the adult brain. Neuron. 2004;41:683–686. - PubMed
    1. Balu R, Pressler RT, Strowbridge BW. Multiple modes of synaptic excitation of olfactory bulb granule cells. J Neurosci. 2007;27:5621–5632. - PMC - PubMed
    1. Belluzzi O, Benedusi M, Ackman J, LoTurco JJ. Electrophysiological differentiation of new neurons in the olfactory bulb. J Neurosci. 2003;23:10411–10418. - PMC - PubMed
    1. Brüstle O, McKay RD. Neuronal progenitors as tools for cell replacement in the nervous system. Curr Opin Neurobiol. 1996;6:688–695. - PubMed

Publication types

Substances

LinkOut - more resources