. 2010 Dec 15;30(50):17068-78.
doi: 10.1523/JNEUROSCI.4067-10.2010.

Neuronal LRP1 knockout in adult mice leads to impaired brain lipid metabolism and progressive, age-dependent synapse loss and neurodegeneration

Affiliations

Neuronal LRP1 knockout in adult mice leads to impaired brain lipid metabolism and progressive, age-dependent synapse loss and neurodegeneration

Qiang Liu et al. J Neurosci. .

Abstract

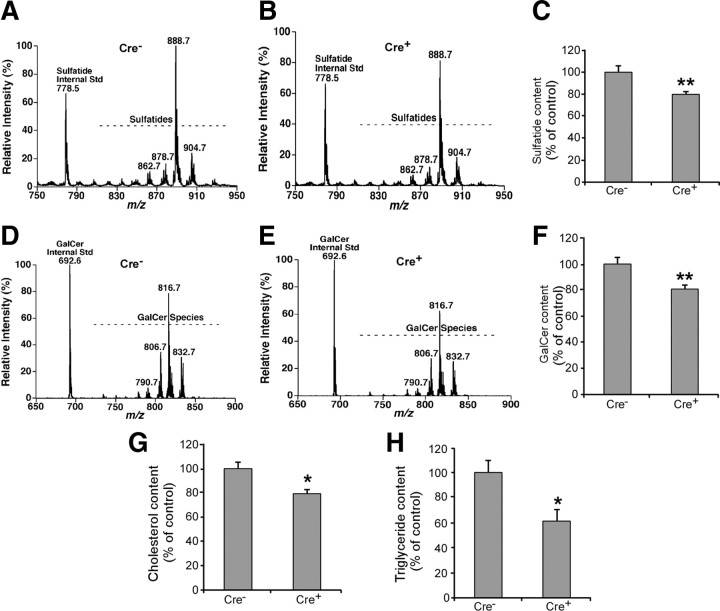
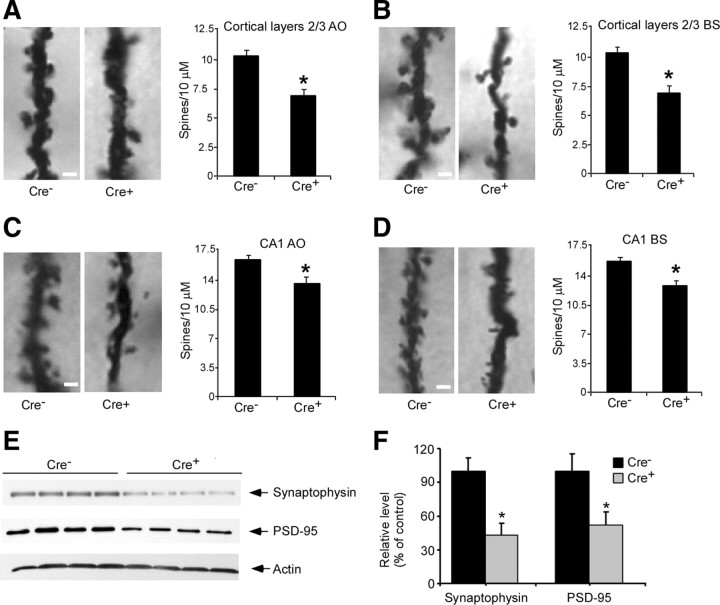
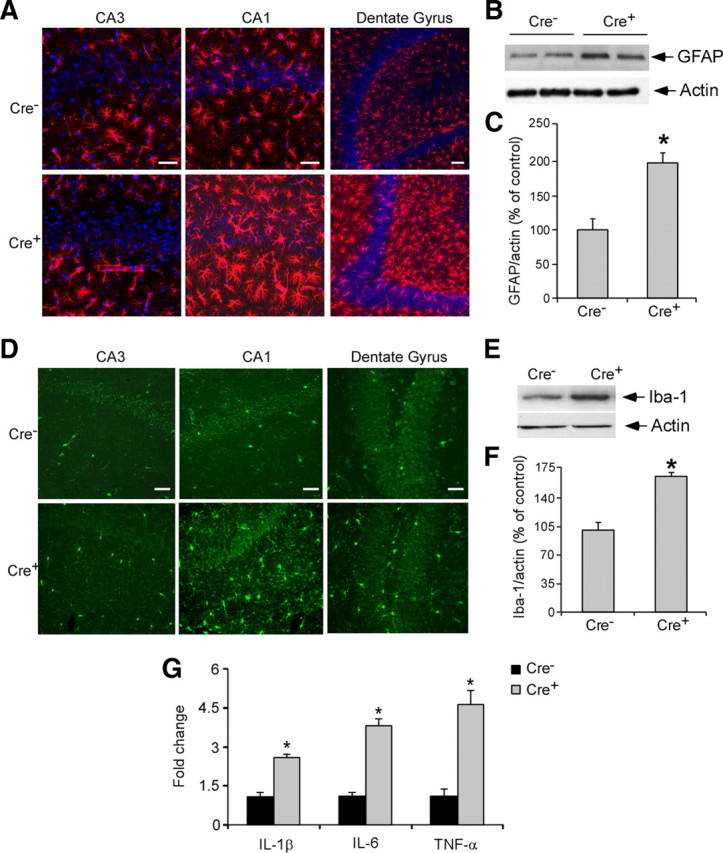
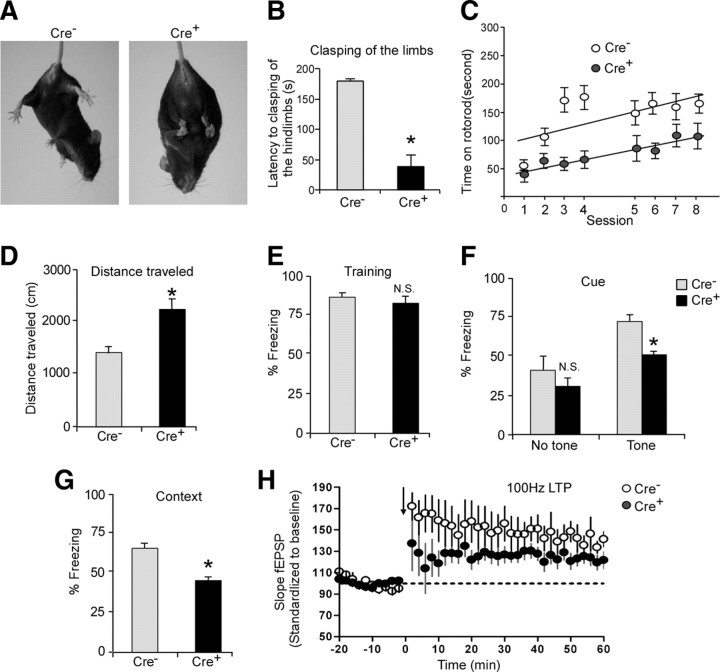
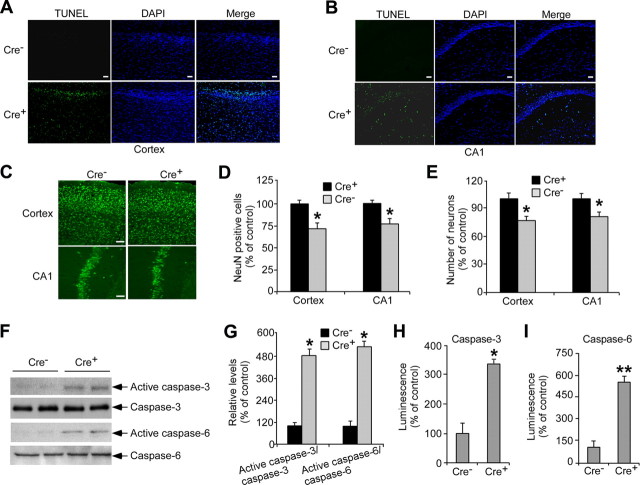
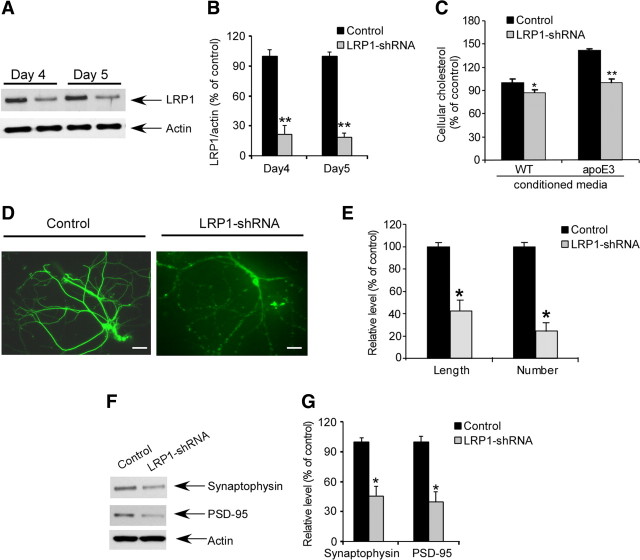
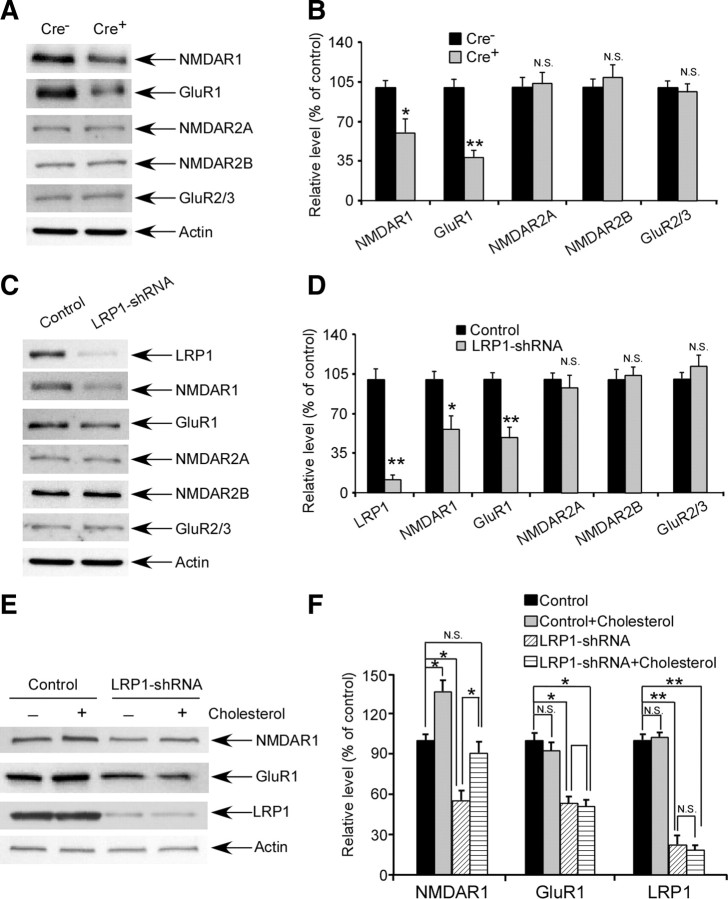
The vast majority of Alzheimer's disease (AD) cases are late onset with progressive synapse loss and neurodegeneration. Although the amyloid hypothesis has generated great insights into the disease mechanism, several lines of evidence indicate that other risk factors might precondition the brain to amyloid toxicity. Here, we show that the deletion of a major lipoprotein receptor, low-density lipoprotein receptor-related protein 1 (LRP1), in forebrain neurons in mice leads to a global defect in brain lipid metabolism characterized by decreased brain levels of cholesterol, sulfatide, galactosylceramide, and triglyceride. These lipid deficits correlate with progressive, age-dependent dendritic spine degeneration, synapse loss, neuroinflammation, memory loss, and eventual neurodegeneration. We further show that the levels of glutamate receptor subunits NMDA receptor 1 and Glu receptor 1 are selectively reduced in LRP1 forebrain knock-out mice and in LRP1 knockdown neurons, which is partially rescued by restoring neuronal cholesterol. Together, these studies support a critical role for LRP1 in maintaining brain lipid homeostasis and associated synaptic and neuronal integrity, and provide important insights into the pathophysiological mechanisms in AD.


Figures

Figure 1.
Figure 1.
LRP1 regulates brain lipid metabolism. Molecular species of lipid extracts from cortexes of 12-month-old Cre+ and Cre mice (n = 5) were analyzed by shotgun lipidomics. A–F, The sulfatides and GalCer contents were reduced in cortical lysates of Cre+ mice. A, B, D, E, The molecular species of sulfatides (A, B) and GalCer (D, E) were indicated in the representative mass spectrometry of Cre+ and Cre mice. C, F, Total sulfatides and GalCer were measured in cortical lysates of Cre+ and Cre mice, normalized against total protein and plotted as a percentage of Cre controls. G, H, The cholesterol and triglyceride contents were reduced in cortical lysates of Cre+ mice. Total cholesterol and triglyceride were measured in cortical lysates of Cre+ and Cre mice, normalized against total protein and plotted as a percentage of Cre controls. The data represent the means ± SD. of at least four separate animals. *p < 0.01, **p < 0.001.
Figure 2.
Figure 2.
LRP1 deletion leads to age-dependent dendritic spine degeneration and synaptic loss. A–D, Representative images of Golgi-impregnated pyramidal neurons in layers II/III the of cortex (A, B) and CA1 region of the hippocampus (C, D) from 18-month-old Cre+ and Cre mice. Spine density was quantified along dendrites from Cre+ and Cre mice (n = 5). Note that the spinal density was significantly decreased in Cre+ mice. E, Expression of synaptophysin and PSD-95 in the cortex was evaluated in 18-month-old Cre+ and Cre mice by Western blotting. Equal amounts of protein in this and subsequent figures were loaded to each lane. F, Densitometric quantification of synaptophysin and PSD-95 expression was performed as described in Experimental Procedures (n = 4). Note that the expression of synaptophysin and PSD-95 was significantly reduced in Cre+ mice. Scale bars, 1 μm. The data represent the means ± SD of at least four separate animals. *p < 0.05.
Figure 3.
Figure 3.
Neuroinflammation in LRP1 forebrain knock-out mice. A, Immunofluorescence staining using a GFAP antibody (detected with Alexa 568, red) and nucleic marker DAPI (blue). Shown are representative stainings of the hippocampus of 18-month-old Cre+ and Cre mice. Scale bars, 50 μm. B, GFAP expression in the hippocampus was evaluated in 18-month-old Cre+ and Cre mice by Western blotting. C, Densitometric quantification of GFAP expression was performed as described in Experimental Procedures (n = 4). Note that GFAP expression was significantly increased in Cre+ mice. D, Immunofluorescence staining using a Iba-1 antibody (detected with Alexa 488, green). Shown are representative stainings of the hippocampus of 18-month-old Cre+ and Cre mice. Scale bars, 25 μm. E, Iba-1 expression in the hippocampus was evaluated in 18-month-old Cre+ and Cre mice by Western blotting. F, Densitometric quantification of Iba-1 expression was performed as described in Experimental Procedures (n = 4). Note that Ib-1 expression was significantly increased in Cre+ mice. G, Expression of IL-1β, IL-6, and TNF-α at the mRNA level in the hippocampus of 18-month-old Cre+ and Cre mice (n = 5) was evaluated by real-time PCR. Note that the levels of IL-1β, IL-6, and TNF-α were significantly increased in the Cre+ mice compared with Cre mice. The data represent the means ± SD of at least four separate animals. *p < 0.01.
Figure 4.
Figure 4.
LRP1 deletion leads to neurobehavioral abnormalities. A, B, Escape reflexes were tested in 13-month-old Cre+ and Cre mice (n = 8). Deletion of LRP1 decreases the latency to clasping of the hindlimbs. The latency was measured for up to 3 min. C, Rotarod performance is impaired in 18-month-old Cre+ mice. Each circle indicates the mean latency to fall on the accelerating rotarod (from 4 to 40 rpm over 5 min) (n = 8, both genotypes). D, Open field activity was tested in 18-month-old Cre+ and Cre mice (n = 8). Total distance traveled during 15 min in the open field. E, No difference in freezing was seen during the last minute of Fear Conditioning. F, G, Impaired cued and contextual fear memory in 18-month-old Cre+ mice 24 h after training (n = 8, both genotypes). H, LTP deficits in Cre+ mice. Brain slices were prepared from the hippocampus of 18-month-old Cre+ and Cre mice. Titanic used to evoke CA1 LTP consisted of two trains of 100 Hz stimulation for 1 s with each train separated by a 20 s interval. The data represent the means ± SEM. *p < 0.05.
Figure 5.
Figure 5.
LRP1 deletion leads to age-dependent neurodegeneration. A, B, TUNEL staining was performed in the cortex and hippocampal CA1 regions of 24-month-old Cre+ and Cre mice (n = 5). Representative images of TUNEL staining are shown (detected with FITC, green and nucleic marker DAPI, blue). Scale bars, 25 μm. C, D, NeuN staining was performed in the cortex and hippocampal CA1 region of 24-month-old Cre+ and Cre mice (n = 5). Representative images of NeuN staining are shown (detected with Alexa 488, green). Scale bars, 25 μm. E, Stereological analysis was performed in the cortex and hippocampal CA1 region of 24-month-old Cre+ and Cre mice (n = 5). F, Levels of active-caspase-3, active-caspase-6, total caspase-3, and total caspase-6 in the cortex were evaluated in 24-month-old Cre+ and Cre mice by Western blotting. G, Densitometric quantification of active caspase versus total caspase was performed as described in Experimental Procedures (n = 4). Note that active-caspase-3 and active-caspase-6 levels were significantly increased in Cre+ mice. H, I, Caspase-3 and caspase-6 activities were measured using a luciferase-based assay system (Promega), normalized against total protein, and plotted as a percentage of Cre controls (n = 4). Scale bars, 100 μm. The data represent the means ± SD of at least four separate animals. *p < 0.05, **p < 0.01.
Figure 6.
Figure 6.
LRP1 knockdown in primary neurons results in neurite degeneration. A, Primary cortical neurons cultured from wild-type C57BL/6J mice were infected by lentivirus carrying LRP1-shRNA on day 8 of in vitro culture. On day 4 and day 5 after infection, LRP1 expression was analyzed by Western blotting. B, Densitometric quantification of LRP1 expression showed that LRP1 was effectively knocked down on day 5 after infection with lentiviral shRNA. C, Following infection of lentiviral LRP1-shRNA in primary neurons, conditioned media from astrocytes of wild-type (WT) control or apoE3 target replacement mice with equal amounts of apoE were added and incubated with neurons for 24 h. Total cholesterol content in neurons under each condition was measured. D, Following infection of lentiviral LRP1-shRNA in primary neurons, conditional media from WT astrocytes was added to the neuronal culture media and immunofluorescence staining was assessed using a microtubule-associated protein (MAP)-2 antibody (detected by Alexa 488, green). Shown are images of representative staining. E, Quantification of neurite length and numbers of MAP-2 staining neurons indicates that LRP1 knockdown significantly reduces the length and numbers of neurites in primary cultured neurons. F, Following infection of lentiviral LRP1-shRNA in primary neurons, expression of synaptophysin, PSD-95, and actin was analyzed by Western blotting. G, Densitometric quantification of Western blots in F showed that the expression of synaptophysin and PSD-95 was significantly decreased in LRP1 knocked down neurons. The data represent the means ± SD. *p < 0.05, **p < 0.01.
Figure 7.
Figure 7.
LRP1 deletion leads to decreased levels of NMDAR1 and GluR1. A, Expression of NMDAR1, NR2A, NR2B, GluR1, and GluR2/3 in the cortex were evaluated in 18-month-old Cre+ and Cre mice by Western blotting. B, Densitometric quantification of Western blots in A was performed as described in Experimental Procedures (n = 4). Note that expression of NMDAR1 and GluR1 was significantly reduced in Cre+ mice. C, Primary cortical neurons cultured from wild-type C57BL/6J mice were infected by lentivirus carrying LRP1-shRNA on day 8 of in vitro culture. On day 5 after infection, expression of LRP1, actin, NMDAR1, NR2A, NR2B, GluR1, and GluR2/3 were analyzed by Western blotting. D, Densitometric quantification of Western blots in C showed that expression of NMDAR1 and GluR1 was significantly reduced in LRP1 knocked down neurons. E, Following infection of lentiviral LRP1-shRNA or control lentivirus in primary neurons, cholesterol was added to the neuronal culture media for 2 d and Western blotting was performed to assess the expression of LRP1, NMDAR1, and GluR1. F, Densitometric quantification of expression of LRP1, NMDAR1, and GluR1 showed that expression of NMDAR1, but not GluR1, was partially rescued by cholesterol in LRP1 knocked down neurons. The data represent the means ± SD. *p < 0.05, **p < 0.01.

References

    1. Baranes D, Lederfein D, Huang YY, Chen M, Bailey CH, Kandel ER. Tissue plasminogen activator contributes to the late phase of LTP and to synaptic growth in the hippocampal mossy fiber pathway. Neuron. 1998;21:813–825. - PubMed
    1. Bosio A, Binczek E, Stoffel W. Functional breakdown of the lipid bilayer of the myelin membrane in central and peripheral nervous system by disrupted galactocerebroside synthesis. Proc Natl Acad Sci U S A. 1996;93:13280–13285. - PMC - PubMed
    1. Bredesen DE. Neurodegeneration in Alzheimer's disease: caspases and synaptic element interdependence. Mol Neurodegener. 2009;4:27. - PMC - PubMed
    1. Bu G. Apolipoprotein E and its receptors in Alzheimer's disease: pathways, pathogenesis and therapy. Nat Rev Neurosci. 2009;10:333–344. - PMC - PubMed
    1. Bu G, Maksymovitch EA, Nerbonne JM, Schwartz AL. Expression and function of the low density lipoprotein receptor-related protein (LRP) in mammalian central neurons. J Biol Chem. 1994;269:18521–18528. - PubMed

Publication types

MeSH terms

Substances