. 2010 Dec 15;30(50):17091-101.
doi: 10.1523/JNEUROSCI.4403-10.2010.

CX3CR1 in microglia regulates brain amyloid deposition through selective protofibrillar amyloid-β phagocytosis

Affiliations

CX3CR1 in microglia regulates brain amyloid deposition through selective protofibrillar amyloid-β phagocytosis

Zhiqiang Liu et al. J Neurosci. .

Abstract

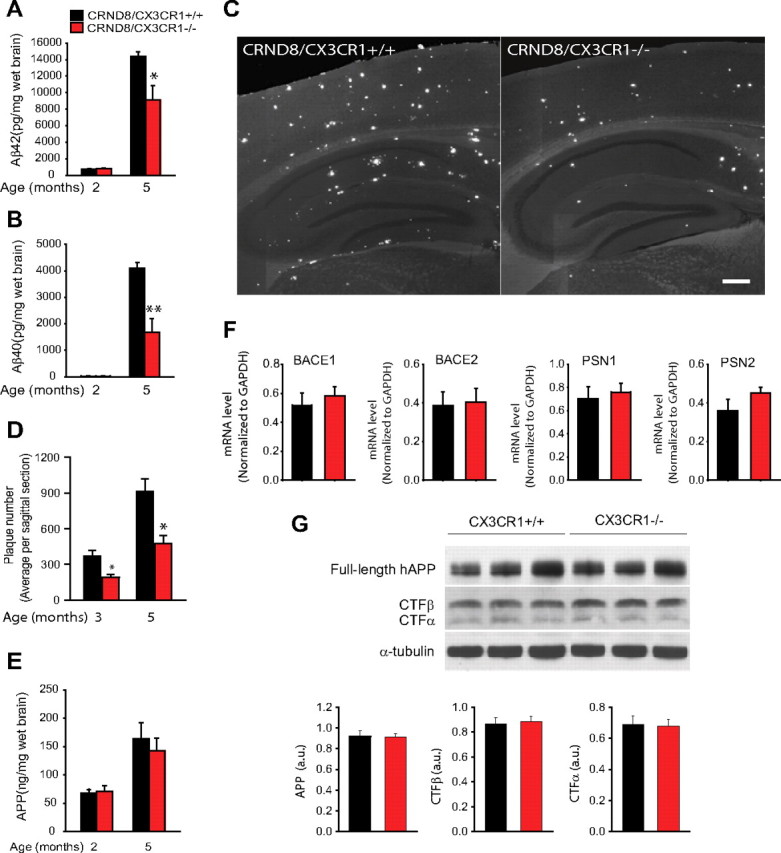
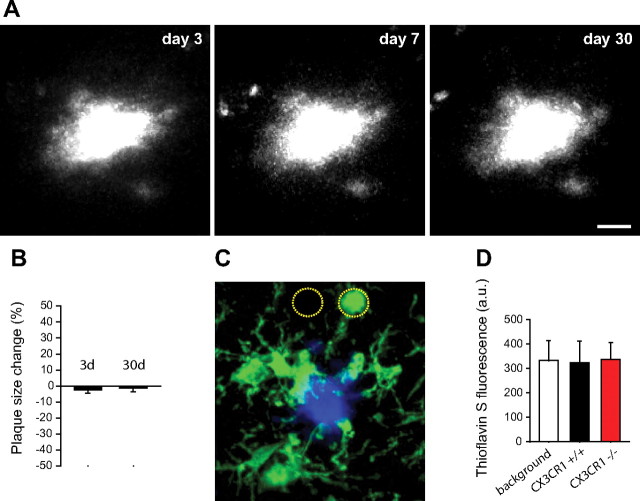
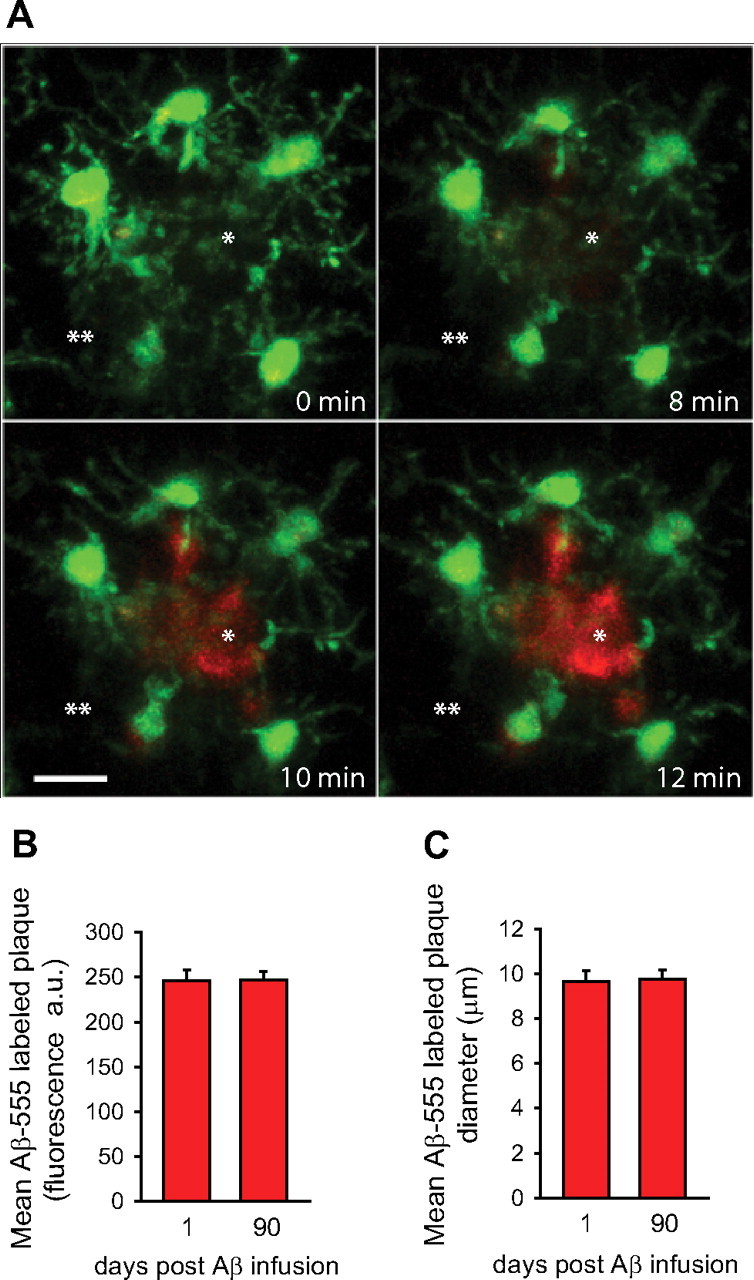
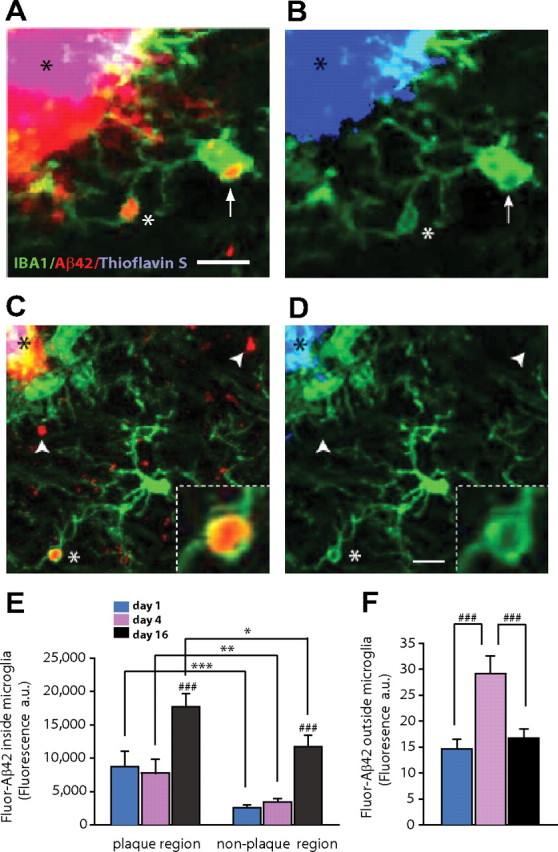
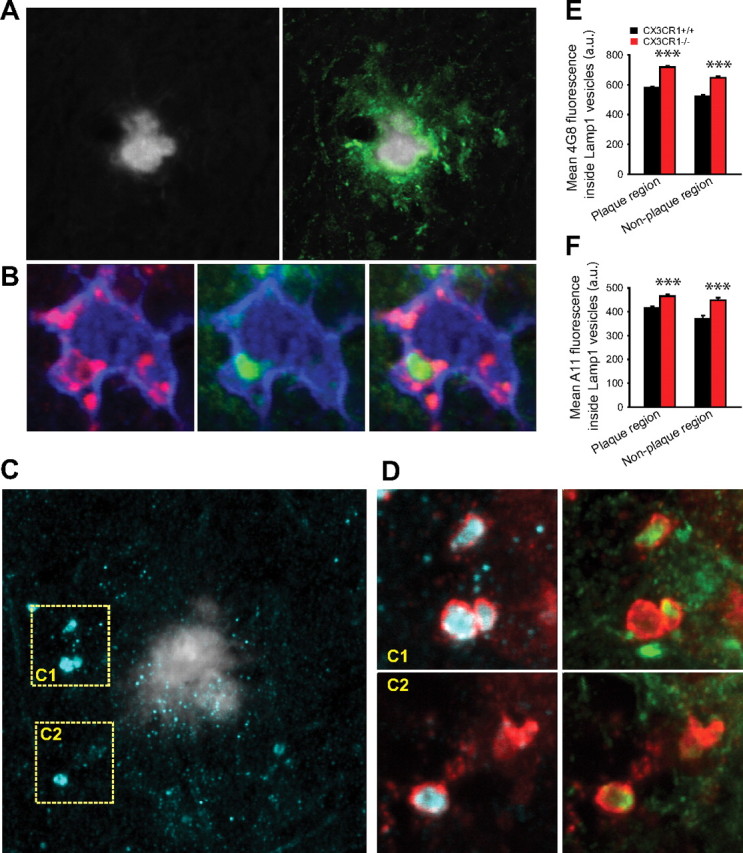
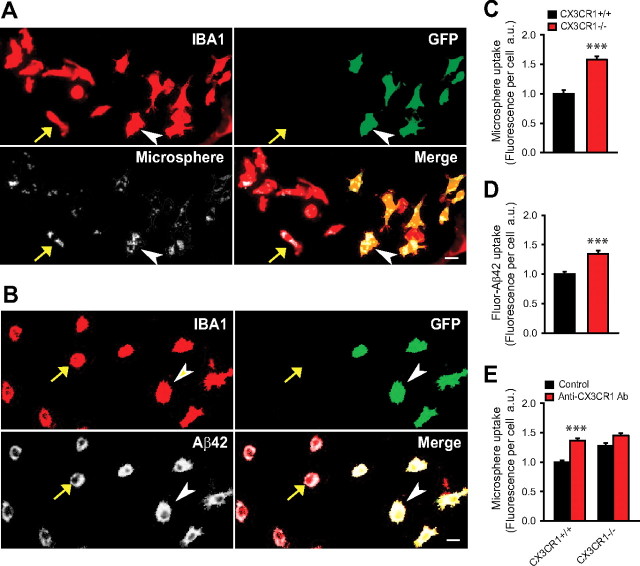
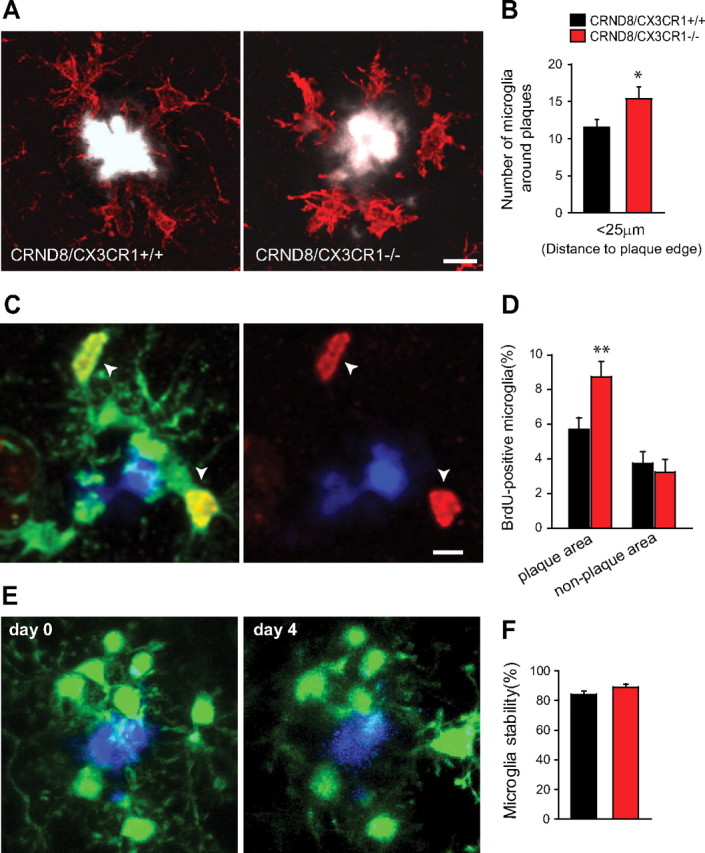
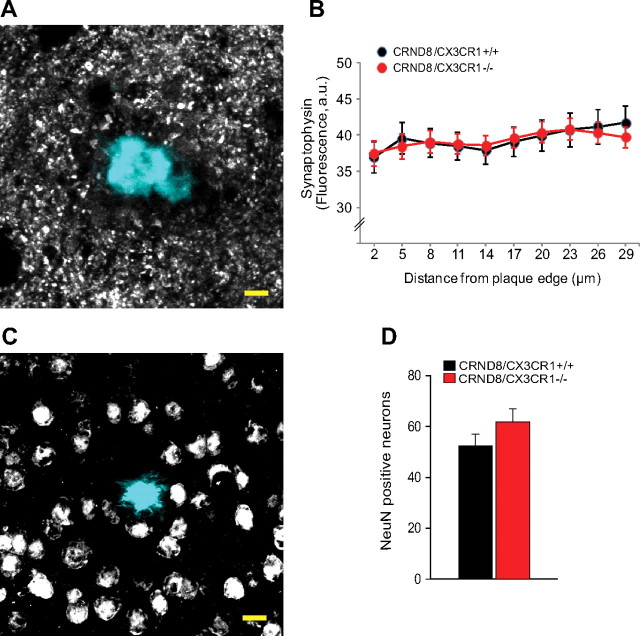
In Alzheimer's disease (AD), amyloid-β (Aβ) deposits are frequently surrounded by activated microglia but the precise role of these cells in disease progression remains unclear. The chemokine receptor CX3CR1 is selectively expressed in microglia and is thought to modulate their activity. To study the specific effects of microglia activation on amyloid pathology in vivo, we crossbred mice lacking CX3CR1 with the Alzheimer's mouse model CRND8. Surprisingly, we found that CX3CR1-deficient mice had lower brain levels of Aβ40 and Aβ42 and reduced amyloid deposits. Quantification of Aβ within microglia and time-lapse two-photon microscopy in live mice revealed that these cells were highly effective at the uptake of protofibrillar amyloid but were incapable of phagocytosis of fibrillar congophilic Aβ. CX3CR1 deletion was associated with increased phagocytic ability, which led to greater amyloid content within microglial phagolysosomes. Furthermore, CX3CR1-deficient mice had an increased number of microglia around individual plaques because of higher proliferative rates, which likely contributed to an overall greater phagocytic capacity. CX3CR1 deletion did not affect the degree of neuronal or synaptic damage around plaques despite increased microglia density. Our results demonstrate that microglia can regulate brain Aβ levels and plaque deposition via selective protofibrillar Aβ phagocytosis. Modulation of microglia activity and proliferation by CX3CR1 signaling may represent a therapeutic strategy for AD.


Figures

Figure 1.
Figure 1.
CX3CR1 deficiency leads to reduced β-amyloid load and deposition. A, B, Total Aβ40 and Aβ42 brain concentrations measured by ELISA were very low at 2 months but increased markedly in 5-month-old mice. The 5-month-old CRND8/CX3CR1−/− mice had significantly lower levels of both Aβ40 and Aβ42 than wild-type littermates (*p < 0.05, **p < 0.01, two-tailed Student's t test; n = 6–7 mice per group; values are expressed as mean ± SEM). C, Representative images of neocortex and hippocampus show fewer thioflavin-S-labeled fibrillar amyloid deposits in a 5-month-old CRND8/CX3CR1−/− mouse than its wild-type littermate. Scale bar, 100 μm. D, Quantification of the average plaque number in sagittal brain sections demonstrates significantly fewer plaques in both 3- and 5-month-old CRND8/CX3CR1−/− mice than wild-type littermates (*p < 0.05, two-tailed Student's t test; n = 4 mice per group; values are expressed as mean ± SEM). E, ELISA measurement of APP levels reveals no difference in CRND8/CX3CR1−/− mice and wild-type littermates (n = 6–7 mice per genotype). F, RT-PCR quantification showed no differential effect of CX3CR1 genotype on mRNA levels of BACE1, BACE2, PSN1, and PSN2 in 2-month-old mice (n = 4 mice per group; values are expressed as mean ± SEM). G, Western blot analysis using a C terminus anti-APP antibody reveals no significant difference in the concentration of APP cleavage products between CX3CR1 genotypes (APP, p = 0.92; CTFβ, p = 0.67; CTFβ, p = 0.78, two-tailed Student's t test; n = 11 mice of average age of 4 months per genotype).
Figure 2.
Figure 2.
Microglia are unable to phagocytose fibrillar congophilic amyloid in vivo. A, Time-lapse in vivo two-photon microscopy of fibrillar amyloid plaques in the mouse cortex. Plaques were labeled with the amyloid binding dye methoxy-XO4 48 h before initial imaging and without relabeling in subsequent sessions. The shape and size of the amyloid plaque at day 3 remains virtually unchanged at days 7 and 30 after labeling. Scale bar, 15 μm. B, Quantification of changes in amyloid plaque size over time from in vivo images shows significant stability (p = 0.92, two-tailed t test; n = 2–4 mice per group and 30 plaques; values are expressed as mean ± SEM). C, Confocal image of IBA1-labeled microglia (green) surrounding a thioflavin-S-labeled amyloid plaque (blue). The intensity of thioflavin-S fluorescence was measured within microglia cell bodies and equivalent areas immediately adjacent but devoid of microglia (dotted circles). D, Fluorescence quantification shows that microglia contain the same negligible levels of blue fluorescence as the immediately adjacent background areas. CX3CR1 genotype had no differential effect on fluorescence within microglia (n = 3 mice, 120 plaques, and >400 microglia per genotype; p > 0.75 between CX3CR1 genotypes and background fluorescence).
Figure 3.
Figure 3.
Exogenous fluorescent Aβ42 binds to plaques with high affinity and remains stably bound for several months. A, HiLyte-555-conjugated soluble Aβ42 was infused through the subarachnoid space, and time-lapse two-photon imaging was obtained during the infusion. A fibrillar plaque (asterisk) was identified by the stereotypical arrangement of surrounding microglia (GFP, green) in a CRND8/CX3CR1+/− mouse and imaged every 2 min. The image shows very rapid binding of Aβ42 to a fibrillar plaque surrounded by microglia (green). The fluorescence intensity outside of the plaque area is very low, suggesting rapid clearance of unbound Aβ42 through the BBB. Quantification of confocal images obtained from brain slices in HiLyte-555 Aβ42-infused mice shows that the average fluorescence intensity (B) and average diameter (C) of labeled plaques in age-matched mice infused 1 or 90 d before killing were virtually identical, demonstrating the lack of any significant removal of recently fibrillized Aβ (n = 3 mice and >200 plaques per time point; p = 0.1678 and 0.8526 for fluorescence intensity and diameter, respectively).
Figure 4.
Figure 4.
Microglia are effective at phagocytosis of noncongophilic amyloid aggregates in vivo. A, Confocal images of brain slices obtained 4 d after in vivo subarachnoid injection of fluorescently labeled-Aβ42 (red) in CRND8/CX3CR1+/− mice. IBA-1-labeled microglia (green) near amyloid plaques have prominent vesicular structures inside their soma (arrow) and processes (white asterisk) that contain fluorescent Aβ42 (red). Also notice the strong binding of Aβ42 to amyloid plaques (red, black asterisk). B, Thioflavin-S strongly labels the same amyloid plaque (black asterisk). However, despite maximally increasing the blue channel intensity, no thioflavin-S fluorescence can be detected within microglia vesicles that contained Aβ42 fluorescent deposits. C, At 4 d after Aβ42 infusion, most Aβ deposits (white arrowheads) appeared outside microglia, but a substantial number of Fluor-Aβ42 aggregates were already engulfed and found within microglia processes and cell bodies (white asterisk; inset). D, Increasing the blue channel brightness to saturation demonstrates that neither engulfed nor extracellular Fluor-Aβ42 deposits colabeled with thioflavin-S, suggesting that these are newly formed protofibrillar Aβ deposits. Scale bar, 5 μm. E, Quantification of Aβ42 fluorescence (red) shows a greater Aβ42 content within microglia located near the plaque edge (within a 25 μm radius) regardless of the postinfusion interval (***p < 0.001, **p < 0.01, *p < 0.05, two-tailed Student's t test). Sixteen days after infusion, an approximately twofold increase in Aβ42 was observed inside microglia (###p < 0.001, two-tailed Student's t test; n = 39–83 microglia from 3 mice per postinfusion time point; values are expressed as mean ± SEM). F, Fluorescence accumulation outside of microglia undergoes an approximately twofold increase 4 d after infusion but declines again at 16 d (###p < 0.001, two-tailed Student's t test; n = 3 mice per postinfusion time point; values are expressed as mean ± SEM).
Figure 5.
Figure 5.
CX3CR1-deficient microglia have an enhanced capacity for protofibrillar Aβ phagocytosis in vivo. A, Confocal image shows a thioflavin-S fibrillar plaque (gray) surrounded by a large halo of 4G8-immunoreactive protofibrillar Aβ (green). B, High-resolution confocal image of a plaque-associated IBA1-labeled microglia (blue) containing a 4G8-immunoreactive Aβ aggregate (green) within a LAMP1-immunoreactive phagolysosome (red). C, Left panel, Thioflavin-S-labeled fibrillar plaque (gray) surrounded by abundant A11-immunoreactive oligomeric Aβ (cyan). D, Insets C1 and C2 correspond to dotted squares in Figure 4C. Large LAMP1-labeled phagolysosomes (red) (which are exclusively present in microglia) (supplemental Fig. 2, available at www.jneurosci.org as supplemental material) contain abundant A11-immunoreactive oligomeric (cyan) and 4G8-immunoreactive protofibrillar Aβ. E, F, Quantification of 4G8 and A11 fluorescence inside LAMP1-immunoreactive phagolysosomes near (<25 μm) and away from fibrillar plaques. Microglial phagolysosomes in CRND8/CX3CR1−/− mice exhibit a significant increase in 4G8 and A11 content in both plaque and nonplaque regions compared with CRND8/CX3CR1+/+ mice (***p < 0.001; values are expressed as mean ± SEM; n = 3 mice, 180 plaques, and >4000 lysosomes per genotype).
Figure 6.
Figure 6.
CX3CR1 deficiency enhances microglia phagocytosis of Aβ peptides and microspheres in vitro. A, B, Dissociated brain cell cultures containing a mixture of CX3CR1+/+ microglia (recognized by lack of GFP label and presence of IBA-1 immunoreactivity; yellow arrow) and CX3CR1−/− microglia (both IBA1 and GFP labeling is present; white arrowhead). After a 2 h incubation with either 2 μm fluorescent microspheres (A) or fluorescence-conjugated Aβ42 (B), cells were imaged and the total amount of fluorescence within microglia of both genotypes was quantified. Scale bar, 10 μm. C, D, Fluorescence intensity within individual microglia showed a 57.7% (microsphere) and 34.7% (Aβ42 peptide) greater uptake, respectively, in CX3CR1−/− than in CX3CR1+/+ microglia (***p < 0.001, two-tailed Student's t test; values are expressed as mean ± SEM; n = 600–967 cells pooled from 3–4 postnatal day 1 pups per group). E, Pretreatment with anti-CX3CR1 neutralizing antibody 2 h before assay significantly increased microsphere uptake in CX3CR1+/+ but not in CX3CR1−/− microglia (***p < 0.001, two-tailed Student's t test; values are expressed as mean ± SEM; n = 706–908 cells per group).
Figure 7.
Figure 7.
Microglia are more abundant around plaques in CX3CR1-deficient mice because of increased proliferation. A, Confocal images show greater number of IBA1-labeled microglia (red) around plaques of similar size (white) in 5-month-old CRND8/CX3CR1−/− mice than in wild-type littermate. Scale bar, 10 μm. B, Quantification of microglia cell bodies within a 25 μm radius of the plaque edge shows a greater number in CRND8/CX3CR1−/− mice than wild-type littermates (*p < 0.05, two-tailed Student's t test; n = 5 animals per genotype; values are expressed as mean ± SEM). C, Confocal image shows several BrdU-labeled (white arrows) IBA1-immunoreactive microglia (green) around an amyloid plaque (blue). Scale bar, 10 μm. D, The proportion of BrdU-labeled microglia within a 25 μm radius from plaques was significantly greater in CRND8/CX3CR1−/− than wild-type littermates (p < 0.01, two-tailed Student's t test; n = 300 and 329 plaques from 3 mice per genotype). There was no significant difference in the percentage of BrdU-labeled microglia in areas distant from plaques (p = 0.64, two-tailed Student's t test; n = 3 mice and ∼1500 microglia per genotype). E, Time-lapse two-photon image of microglia (green) and a methoxy-XO4-labeled amyloid plaque (blue) over a 4 d interval. The majority of microglia in the immediate vicinity of plaques appears stable. F, Quantification of changes in microglia number/position demonstrates no difference between CX3CR1 genotypes at least over this short time interval of 4 d (p = 0.11 for both groups, two-tailed t test; n = 6–7 mice and 67–69 plaques for CRND8/CX3CR1+/− and CRND8/CX3CR1−/−, respectively; values are expressed as mean ± SEM).
Figure 8.
Figure 8.
CX3CR1 deficiency does not alter the degree of neuronal or synaptic damage around plaques. A, Confocal images of synaptophysin-immunoreactive puncta (gray) around thioflavin-S-labeled amyloid plaques (cyan) were quantified by measuring their density at different distances from the plaque edge. B, No statistically significant difference was observed in synaptophysin density at any point up to ∼30 μm away from the plaque edge in CX3CR1-deficient mice compared with wild-type littermates (p > 0.05, two-tailed t test for all distances; n = 30 plaques from 3 5-month-old male mice per genotype; values are expressed as mean ± SEM). C, Confocal images of NeuN-immunoreactive neurons (gray) around thioflavin-S-labeled amyloid plaques (cyan) were quantified by counting the number of neuronal cell bodies present within a standardized three-dimensional volume around plaques. Scale bar, 10 μm. D, No statistically significant difference was observed in the density of NeuN-immunoreactive neurons in CX3CR1-deficient mice compared with wild-type littermates (p > 0.05, two-tailed t test; 3 mice per genotype and 23 plaques; values are expressed as mean ± SEM).

References

    1. Ajami B, Bennett JL, Krieger C, Tetzlaff W, Rossi FM. Local self-renewal can sustain CNS microglia maintenance and function throughout adult life. Nat Neurosci. 2007;10:1538–1543. - PubMed
    1. Alves-Filho JC, Freitas A, Souto FO, Spiller F, Paula-Neto H, Silva JS, Gazzinelli RT, Teixeira MM, Ferreira SH, Cunha FQ. Regulation of chemokine receptor by Toll-like receptor 2 is critical to neutrophil migration and resistance to polymicrobial sepsis. Proc Natl Acad Sci U S A. 2009;106:4018–4023. - PMC - PubMed
    1. Bacskai BJ, Kajdasz ST, McLellan ME, Games D, Seubert P, Schenk D, Hyman BT. Non-Fc-mediated mechanisms are involved in clearance of amyloid-β in vivo by immunotherapy. J Neurosci. 2002;22:7873–7878. - PMC - PubMed
    1. Block ML, Zecca L, Hong JS. Microglia-mediated neurotoxicity: uncovering the molecular mechanisms. Nat Rev Neurosci. 2007;8:57–69. - PubMed
    1. Bolmont T, Haiss F, Eicke D, Radde R, Mathis CA, Klunk WE, Kohsaka S, Jucker M, Calhoun ME. Dynamics of the microglial/amyloid interaction indicate a role in plaque maintenance. J Neurosci. 2008;28:4283–4292. - PMC - PubMed

Publication types

LinkOut - more resources