. 2011 Feb;105(2):860-71.
doi: 10.1152/jn.01056.2010. Epub 2010 Dec 15.

Incomplete inactivation and rapid recovery of voltage-dependent sodium channels during high-frequency firing in cerebellar Purkinje neurons

Affiliations

Incomplete inactivation and rapid recovery of voltage-dependent sodium channels during high-frequency firing in cerebellar Purkinje neurons

Brett C Carter et al. J Neurophysiol. 2011 Feb.

Abstract

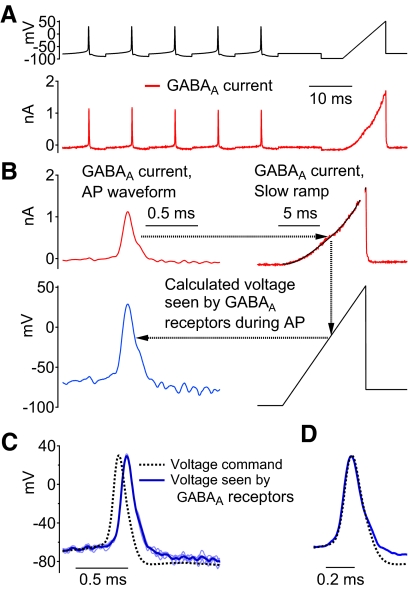
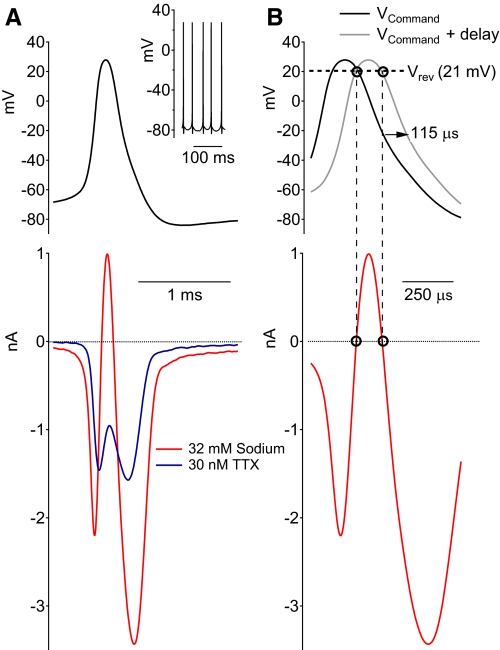
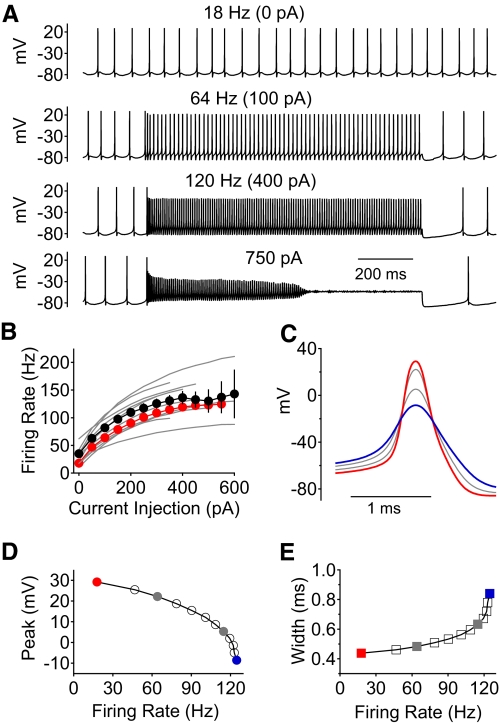
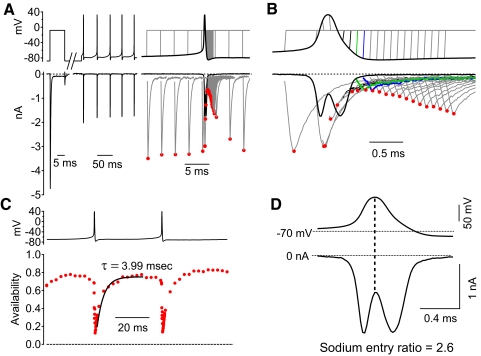
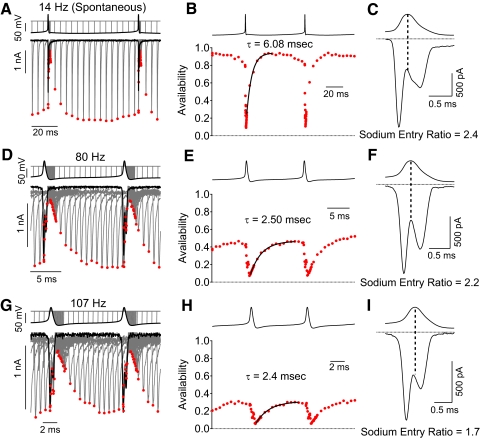
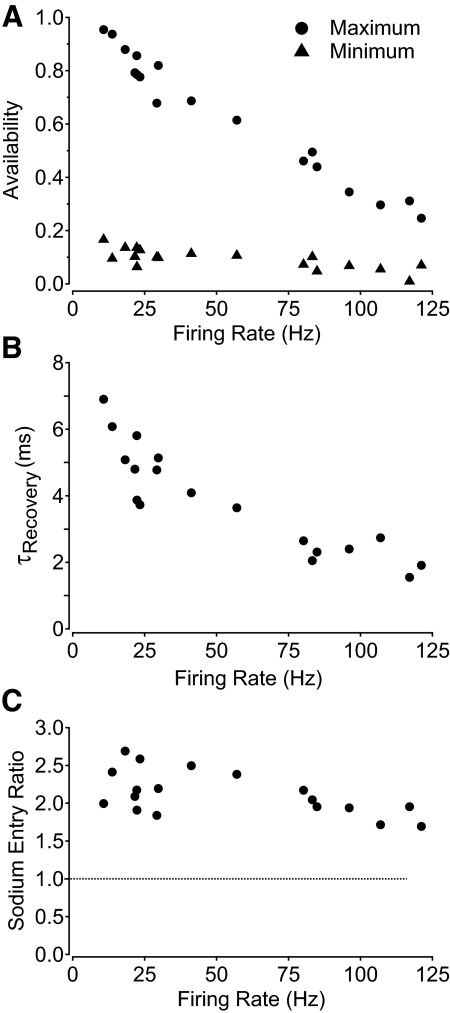
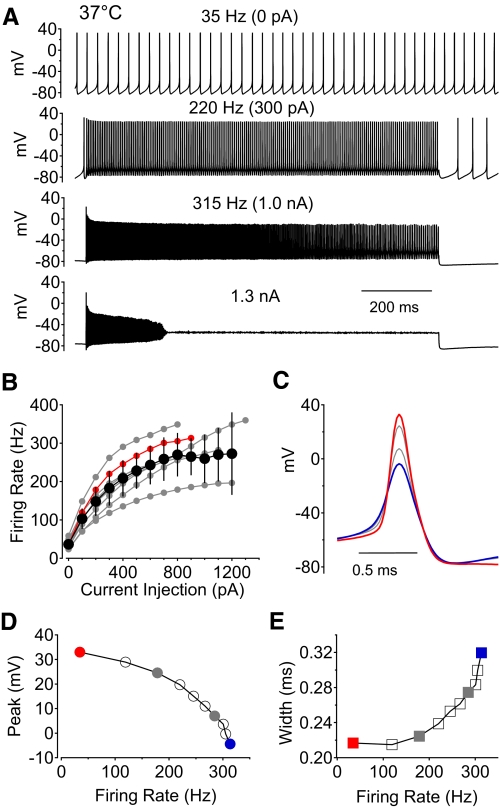
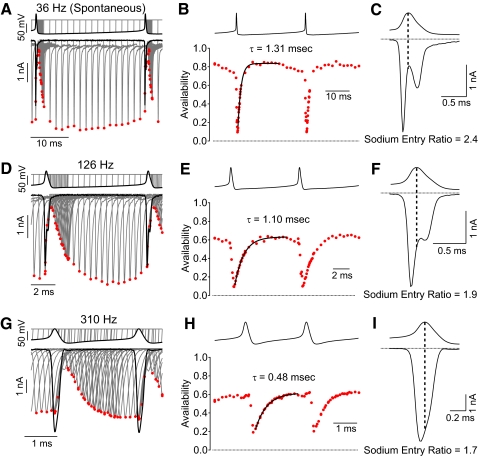
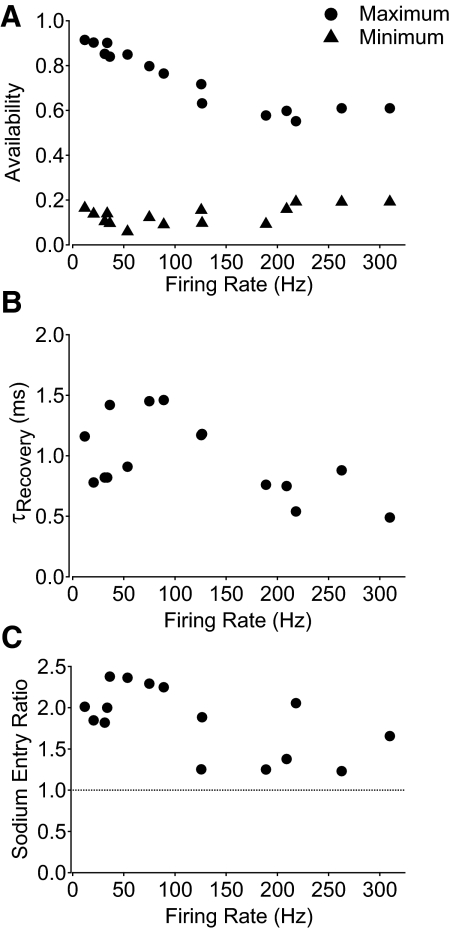
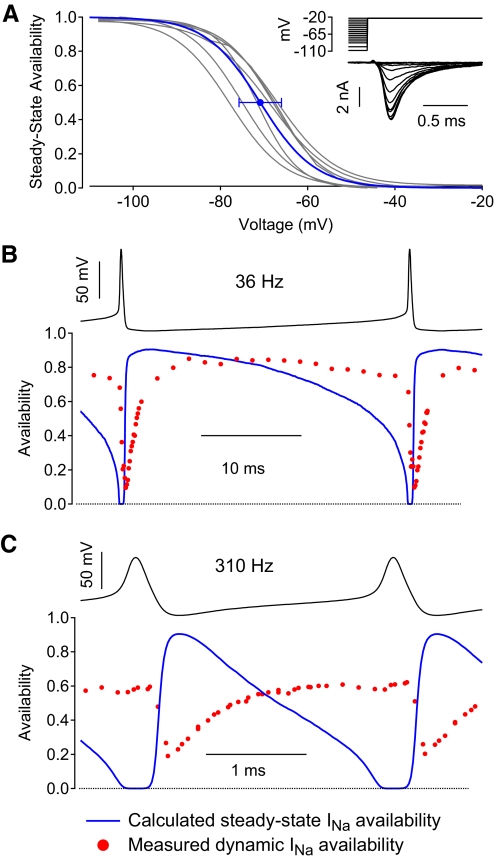
Purkinje neurons can spike very rapidly for sustained periods. We examined the cycle of sodium channel gating during high-frequency firing of Purkinje neurons, focusing on the kinetics of sodium channel inactivation and recovery during and after spikes. To analyze sodium channel availability during spiking, we recorded the firing patterns of acutely dissociated Purkinje neurons in current clamp and used these records as command voltages in voltage-clamp experiments in the same cell, adding step depolarizations at various points to assay availability. Sodium channel availability decreased abruptly during the spike, as expected, but never reached zero. During spontaneous firing (∼ 40 Hz at 37°C), availability decreased from nearly 90% before the spike to about 10-20% after the spike. With fast steady firing stimulated by current injection (∼ 300 Hz at 37°C), the availability decreased from about 60% between spikes to roughly 15-20% after the spike. Thus even at the fastest firing rates, sodium channel inactivation is incomplete after a spike, leaving a substantial fraction of sodium channels immediately available for activation. Also, inactivation recovered quickly during the early interspike interval (time constant ∼ 1 ms at 37°C), but developed slowly during the depolarization of the late interspike interval, ensuring high availability until spike threshold. These features of sodium channel gating, especially the availability remaining after the spike, reduce the refractory period and facilitate rapid repetitive firing.


Figures

Fig. 1.
Fig. 1.
Measurement of action potential clamp fidelity using muscimol-evoked γ-aminobutyric acid type A (GABAA) currents. A, top: the voltage command, composed of repeated prerecorded Purkinje neuron action potentials followed by a slow (15 mV/ms) voltage ramp. Bottom: currents evoked by 5 μM muscimol recorded in the presence of 1 μM tetrodotoxin (TTX) and with tetraethylammonium (TEA) replacing external Na (obtained by subtraction of traces acquired immediately before muscimol application). B: muscimol-evoked current (red traces) during an action potential was converted to membrane voltage seen by the GABAA receptors in the cell membrane (blue trace) by comparing each point during the action potential with the current during the slow voltage ramp. To reduce noise, the ramp-evoked current was fit by a smooth curve (an empirical polynomial fit). C: membrane voltage (5 individual traces shown in light blue, average in dark blue) calculated from the muscimol-evoked current matches well with the command voltage (black dashed trace) except for a time delay. D: the same traces as in C but with the calculated membrane voltage shifted by 80 μs.
Fig. 2.
Fig. 2.
Measurement of time delay in cell membrane voltage using sodium channel reversal potential. A: spontaneous action potentials recorded in current clamp (inset) were used as the voltage-clamp command (top trace). Sodium currents evoked by the action potential waveform were recorded after being reduced either by partial block with 30 nM TTX (blue trace) or by reducing the extracellular concentration of sodium from 160 to 32 mM (red trace). B: using the traces recorded with 32 mM sodium, the delay in the voltage seen by the cell membrane was estimated by aligning the time of current reversal from inward to outward so that it matched the time at which the expected reversal potential of +21 mV occurred during the voltage command. The time delay in the current record for this neuron was 115 μs, of which 40 μs can be ascribed to the effect of the low-pass filter (a 10-kHz 4-pole Bessel filter) used to filter the current record.
Fig. 3.
Fig. 3.
Collected results of the time delay of voltage at the cell membrane relative to command voltage. The delay was measured either by aligning muscimol-evoked currents (as in Fig. 1, black circles) or by aligning the action potential voltage command with the altered sodium reversal potential (as in Fig. 2, gray squares). The measured delays shown were corrected for the 40 μs delay arising from the low-pass Bessel filter. The delay was found to be correlated with the residual series resistance remaining after partial series resistance compensation. The solid line is the best-fit linear relationship.
Fig. 4.
Fig. 4.
Spontaneous and stimulated Purkinje neuron action potential firing in response to current injection at 23°C. A: example of voltage recordings of spontaneous action potential firing (top), and firing evoked by 1 s long current injections of increasing magnitude until the neuron ceased firing during the stimulating pulse (in this case during an injection of 750 pA). B: summary of results from 13 neurons plotting the firing frequency vs. current injection; black symbols represent average ± SD and the red symbols are from the example neuron shown in A, C, D, and E. Only pulses in which firing was sustained throughout the full 1-s current injection were included in the average. C: averaged action potentials from each level of current injection for the cell in A, illustrating the change in action potential shape with firing frequency. Red trace: spontaneous action potential. Blue trace: action potential of the most rapid firing before failure. D: action potential peak voltage as a function of firing frequency. E: action potential width (measured at half the maximal amplitude) as a function of firing frequency.
Fig. 5.
Fig. 5.
Measurement of sodium channel availability during action potential firing. A: each voltage command waveform started with a test step to −8 mV from a holding potential of −88 mV to measure full sodium channel availability, followed by about 150 ms of spontaneous action potential firing that was recorded in the same neuron and finally a voltage step to −8 mV to measure availability, added at different times during and after the last action potential in each of 80 different waveforms. The sodium current elicited by the waveforms is shown below. Currents were reduced to controllable values using subsaturating (30 nM) TTX and currents blocked by subsequent addition of 1 μM TTX were subtracted. Peak current during each step is marked by a red circle. B: sodium currents evoked by a subset of the waveforms shown on a finer timescale. Green traces show the voltage protocol and elicited current corresponding to the minimum availability, achieved shortly before the trough of the action potential. Blue traces correspond to measurements 100 μs later, when recovery from inactivation is just beginning. C: sodium channel availability was measured as peak current evoked by the second pulse to −8 mV, normalized to the current evoked by the first pulse to −8 mV from a holding potential of −88 mV, where essentially all channels are available (Fig. 11A). Availability is plotted as a function of the time during the firing cycle that the second pulse was delivered. Sodium channel availability immediately after the action potential reached a minimum of 13%. The time course of recovery of availability during the interspike interval (ISI) could be fit well by a single exponential with a time constant of 3.99 ms (black trace), with sodium channel availability reaching a maximum of 78% in between spikes. D: sodium current during the action potential waveform showed incomplete inactivation and a large amount of sodium current during the downstroke of the action potential (a sodium entry ratio of 2.59).
Fig. 6.
Fig. 6.
Sodium channel availability during spontaneous and stimulated action potential firing in the same neuron. A: voltage-clamp recordings of sodium current during spontaneous firing, with availability measured using a test step to −8 mV added at various times before, during, and after a spike as in Fig. 5. B: sodium channel availability (current during second pulse normalized to current evoked by a first pulse to −88 mV) plotted as a function of the time during the firing cycle. C: sodium current during the action potential, showing incomplete inactivation during the falling phase. D–F: same analysis but using waveform of higher firing frequency evoked by steady current injection in the same neuron. G–I: same analysis but for a firing frequency near maximal for the same neuron.
Fig. 7.
Fig. 7.
Collected results for measurements of sodium channel availability during action potential firing at 23°C. A: maximum availability in between spikes (filled circles) and minimum availability after spikes (filled triangles) during repetitive action potential firing at different frequencies. B: kinetics of recovery of sodium channel availability from minimum to maximum during the ISI, expressed as the time constant for a single exponential fit to the recovery. C: sodium entry ratio during the action potential as a function of firing rate.
Fig. 8.
Fig. 8.
Current-clamp recordings of spontaneous and stimulated firing in response to current injection at 37°C. A: voltage recordings of spontaneous action potential firing (top) and firing evoked by 1 s long current injections of increasing magnitude until the neuron ceased firing during the stimulating pulse (in this case during an injection of 1.3 nA). B: summary of results from 8 neurons plotting the firing frequency vs. current injection. Black symbols represent average ± SD; the red symbols are from the example neuron shown in A, C, D, and E. Only pulses in which firing was sustained throughout the full 1-s current injection were included in the average. C: averaged action potentials from the cell in A for each level of current injection, illustrating the change in action potential shape with firing frequency. Red trace: spontaneous action potential. Blue trace: action potential of the most rapid firing before failure. D: action potential peak voltage as a function of firing frequency. E: action potential width (measured at half the maximal amplitude) as a function of firing frequency.
Fig. 9.
Fig. 9.
Sodium channel availability during rapid action potential firing at 37°C. Measurements were made as in Figs. 5 and 6. A: voltage-clamp recordings of sodium current during spontaneous firing with availability measured using a test step to −8 mV added at various times during the firing cycle. B: sodium channel availability during the firing cycle. C: sodium current during the action potential, showing incomplete inactivation during the falling phase. D–F: same analysis but using waveform of higher firing frequency evoked by steady current injection in the same neuron. G–I: same analysis but for a firing frequency near maximal for a different neuron.
Fig. 10.
Fig. 10.
Collected results for measurements of sodium channel availability during action potential firing at 37°C. A: maximum availability between spikes (filled circles) and minimum availability after spikes (filled triangles) during repetitive action potential firing at different frequencies. B: kinetics of recovery of sodium channel availability from minimum to maximum during the ISI, expressed as the time constant for a single exponential fit to the recovery. C: sodium entry ratio during the action potential as a function of firing rate.
Fig. 11.
Fig. 11.
Comparison of measured instantaneous availability with predicted steady-state sodium channel availability during firing cycles. A: steady-state availability was measured as a function of voltage at 37°C using 500-ms steps to various voltages followed by a test step to −23 mV. Inset shows example sodium currents from a typical neuron; 30 nM TTX was used to reduce the magnitude of sodium currents to controllable sizes. Gray traces show inactivation curves determined in each of 6 neurons. Blue trace is the Boltzmann curve corresponding to average midpoint and average slope from the 6 neurons; error bars indicate SD of the midpoints determined in individual neurons. B: measured availability (red circles) during the firing cycle during spontaneous firing compared with the steady-state availability (blue) calculated from the average curve in A. C: same for rapid, stimulated firing. Experimental measurements of availability in B and C are from cells shown in Fig. 9, B and H.

References

    1. Aldrich RW, Corey DP, Stevens CF. A reinterpretation of mammalian sodium channel gating based on single channel recording. Nature 306: 436–441, 1983 - PubMed
    1. Alle H, Roth A, Geiger JR. Energy-efficient action potentials in hippocampal mossy fibers. Science 325: 1405–1408, 2009 - PubMed
    1. Armstrong CM. Sodium channels and gating currents. Physiol Rev 61: 644–683, 1981 - PubMed
    1. Armstrong CM. Na channel inactivation from open and closed states. Proc Natl Acad Sci USA 103: 17991–17996, 2006 - PMC - PubMed
    1. Bezanilla F, Armstrong CM. Inactivation of the sodium channel. I. Sodium current experiments. J Gen Physiol 70: 549–566, 1977 - PMC - PubMed

Publication types

Substances

LinkOut - more resources